
In this blog post we discuss the dislocations to the emerging market (EM) asset class generated by the coronavirus pandemic and assess the fundamental shift in liquidity for both local currency and hard currency bonds. The EM asset class has evolved meaningfully over the years leading to differentiation in performance and liquidity. These are important factors and considerations for investors making strategic or tactical allocations to EM.
Difference in Performance Between Local, External Bonds and EM FX
With regard to local rates, yields initially rose sharply in March as global liquidity contracted aggressively. Despite growing market concerns around the size of the fiscal response required to put a flow under growth in key EM economies, yields have actually moved lower due to the implementation of accommodative monetary policies (e.g., rate cuts, open market operations and quantitative easing in some cases). As a consequence, local rates have been the most resilient EM sector, with positive returns offsetting the steep correction in FX.
Turning to foreign exchange, EM currencies (EM FX) weakened dramatically toward the end of 1Q20. Fundamentally, reduced implied yields and a weaker macro outlook have reoriented central banks to focus on generating growth over price stability. This combined with the propensity for foreign investors to invest locally, FX hedged, has put pressure on currency valuations. More recently, helped by improving prospects for global growth as economies slowly start reopening, EM FX has shown signs of stabilization and should do well in a broader risk-on environment.
The second observation is that EM hard currency spreads widened significantly as the crisis began and as investor outflows accelerated. Again, we see market liquidity challenges in the second half of March as the principal driver of this move. As policy measures started to underpin global sentiment and the pace of outflows started to abate, IG sovereign spreads turned the corner and have maintained a tightening bias since early April. This trend has remained steady despite robust primary market activity in IG over the same span.
The dynamic is notably different with respect to HY sovereign spreads, however. While market liquidity has improved in this segment of the market since late March, spreads only recently started to tighten. We see elevated external vulnerabilities in many of these economies—in conjunction with the Covid-driven shock to commodity prices, remittances and tourism—as a sustained headwind to spreads that will keep volatility elevated. While primary market activity may pick up on the back of the late rally, we think these openings will only occur in fits and starts. Market access will remain out of reach for a number of countries in the very near-term.
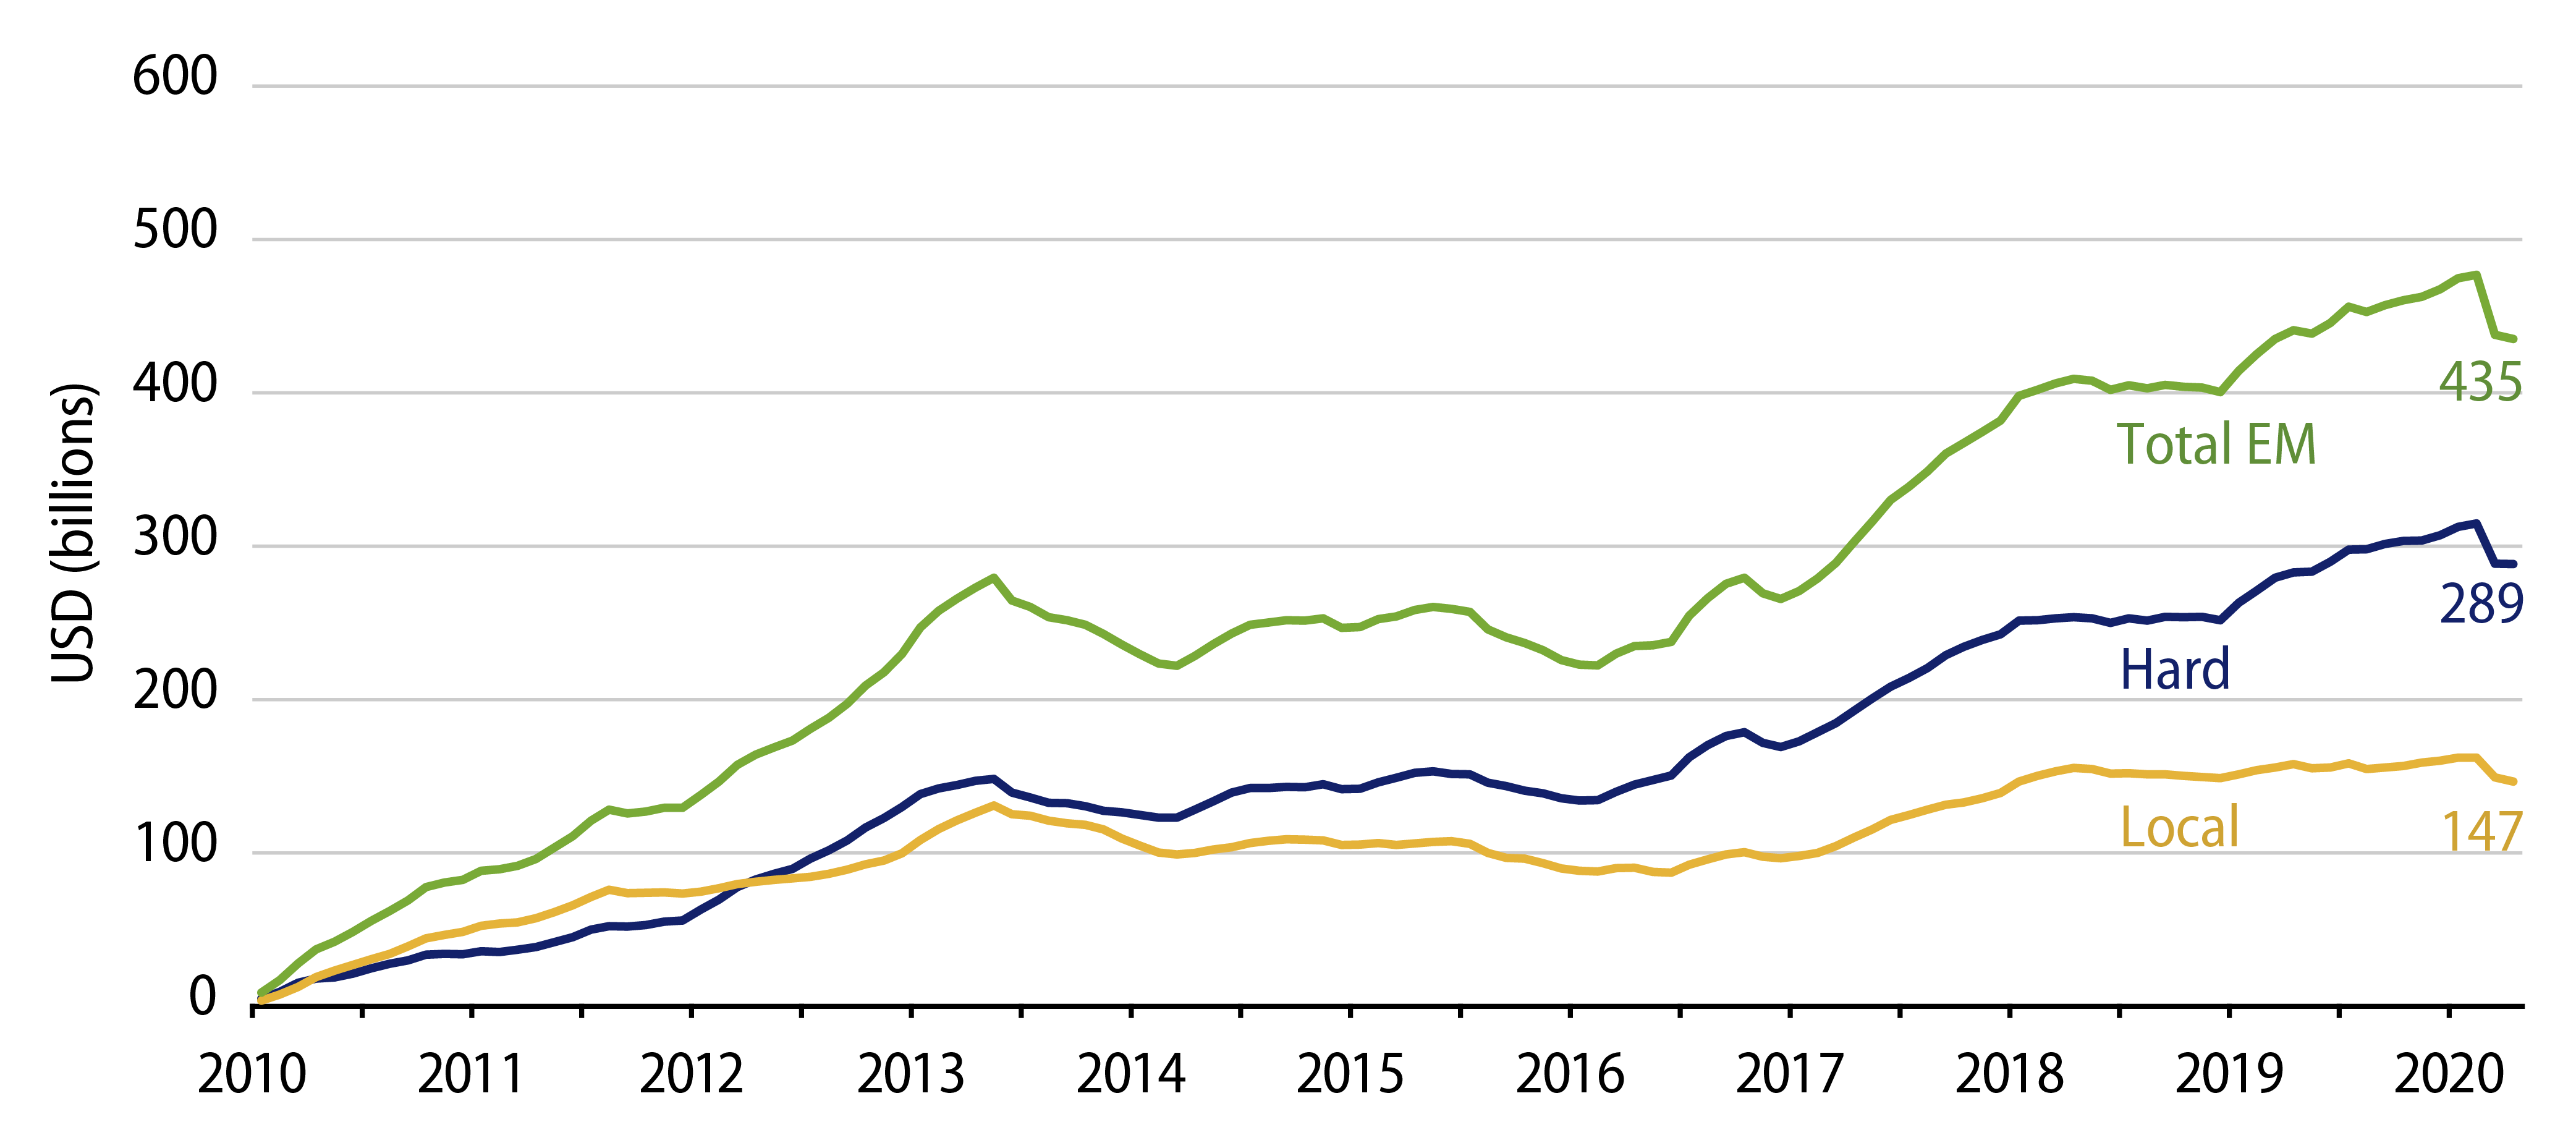
Investors have reduced exposure to the asset class following COVID-19 related volatility (Exhibit 1).
Divergence in Liquidity Within EM
Liquidity in hard currency bonds has been on a steady decline since the global financial crisis (GFC). We think there are a few drivers behind this. First, and most importantly, the introduction of banking regulations after the GFC has limited the ability of banks to make markets and resulted in increased price volatility and wider bid/offer spreads.
Second, we see the proliferation of issuance from lower-rated countries as a contributor to weaker hard currency liquidity. Indeed, in single B rated credits specifically, we tend to see highly pro-cyclical market behavior. Demand for these credits can be insatiable, at times, when non-traditional EM investors flee low yields offered in developed markets and chase risk. Conversely, in periods of weakening risk appetite, these investors tend to exacerbate the downswing as they rush for the exit. In markets characterized by frequent alternation between risk-seeking and risk-averse investor attitudes, the pro-cyclicality of flows forces bid/ask spreads to widen materially.
Liquidity for EM corporate bonds has been poor as well, but this is primarily due to a lack of primary supply and low secondary volumes. What’s interesting here is that the lack of supply has generated a positive technical that has allowed corporates to outperform sovereigns with lower volatility. Another consideration has been that local yield curves in respective countries have fallen and corporates may find cheaper funding options domestically.
Over the last 20 years, local markets have continued to develop with more tenors, deeper market participation and overall lower yields. As local asset managers and pension funds grew, they became a natural buying base for local paper allowing for more liquidity.
EM currencies have generally been more liquid in terms of volumes traded and have also become the most volatile. They are a natural hedging tool for investors, which partly explains recent underperformance.
A Closer Look at Recent Liquidity Stress Episodes—Signs of Recovery in Select Markets
Liquidity deteriorated severely toward the end of 1Q20 as COVID-19 spread and business shutdowns were announced globally. Markets at times felt broken as participants worked remotely with dealers bidding defensively for hard currency bonds—several points below indicated levels on their pricing runs. Local markets experienced similar price dislocations as foreign investors looked to reduce exposures and domestic players, that have generally been providers of liquidity, were on the sidelines. Prior to the recent stress, bid/offer in yield terms ranged from 3-10 bps in lower beta/liquid markets and 10-25 bps in more volatile markets. During the stress period, bid/offer spreads typically doubled and even tripled in some cases. Since then, we have seen a decent recovery in that indications are now transactable for both credit and local markets. Liquidity for derivatives also returned and interest rate swaps (IRS) as well as credit default swaps (CDS) became viable hedging vehicles again. EM FX remain the most liquid but are also first to react to macro and micro factors. Call it the relief valve for both economic and positioning imbalances.
Conclusion
The market's varied and variable liquidity landscape is here to stay. Structural shifts in issuance patterns and industry regulations will ensure that's the case. The aftershocks of the Covid crisis will further contribute to this dynamic. But opportunities also arise in challenging times. Indeed, we were successful in monetizing meaningful new-issue premiums in the early stages of the market stabilization. And we will remain vigilant of risks, and mindful of opportunities, that can contribute positively to risk-adjusted returns going forward.