The first two months of 2020 saw outsized moves in both US Treasury (UST) yields and US credit spreads, driven by the coronavirus/COVID-19 outbreak and its significant impact on the global economic growth outlook. By the end of February, the 10-year UST yield rallied 77 bps to 1.15% whereas the US IG corporate spread widened 29 bps to 122 bps. How extreme was this market move in a historical context?
At the beginning of 2020, our proprietary risk system, WISER, estimated volatility on the 10-year UST yield at 70 bps (annualized) and IG corporate spread at 28 bps (annualized). The magnitude of the Jan-Feb move was equivalent to a 2.6-2.7 sigma (standard deviation) event. Under normal distribution assumptions, the chance of market moves larger than this in magnitude is roughly only 0.5% or less (1 in 200), so it was a really big market move — a tail event, from a risk model perspective.
However, it can be argued that using normal distribution assumptions is likely to underestimate the probability of tail events. We know that tail events in financial markets tend to occur more often than implied by normal distribution (fatter tails). Thus it may be helpful to examine the magnitudes in an empirical manner. Exhibit 1 shows frequency distribution of both series using the past 30 years of bi-monthly data (1990-2019; a total of 180 data points). The bin that the Jan-Feb 2020 move falls into is highlighted in red.
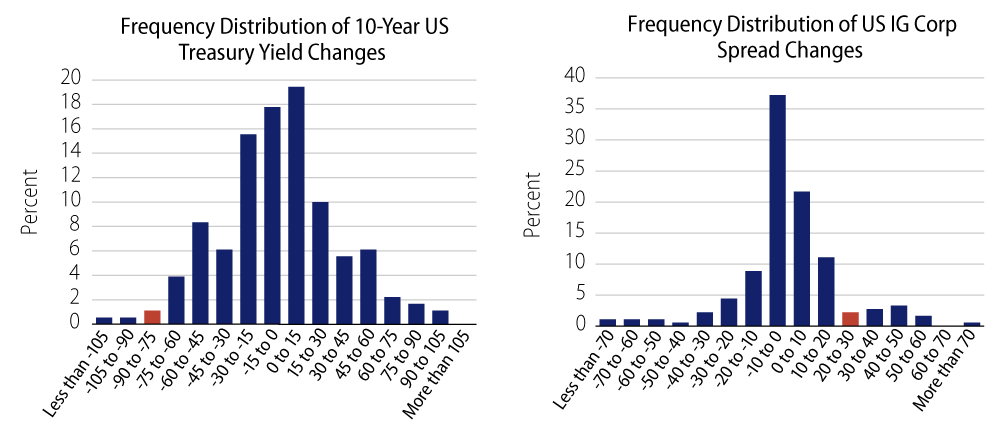
In the past 30 years, there were five instances when the 10-year UST yield rallied by more than 70 bps in two months — a historical frequency of about 2.8% (1 in 36). This is almost six times more likely to happen than implied by normal assumptions but still quite an extreme tail event. It happened two times in the 1990s when yields were much higher, in the 6%-8% range. More recently, we saw a 174 bps rally in Nov-Dec 2008 at the height of the financial crisis, and two more instances in May-Jun 2010 (-72 bps) and Jul-Aug 2011 (-94 bps) in the days of quantitative easing (QE1 and QE2).
The move in IG corporate spread was relatively less extreme than it was for the 10-year UST yield. In the past 30 years there were 15 instances, or 8.3% (1 in 12) in historical frequency, when the IG spread widened by more than 29 bps in two months. This is about 16 times more likely to happen than implied by normal assumption. It happened five times before 2007 with an average widening of 41 bps, five times during the 2007-2008 financial crisis, including the 271 bps blowout in Sep-Oct 2008, and five more times after the crisis with an average widening of 41 bps. The most recent occurrence was a 32 bps widening in Jan-Feb 2016, driven by the concerns of a China-led global growth slowdown.
What does this mean for market volatility going forward? The market is likely to remain volatile in the short term, given significant uncertainty about the spread of COVID-19 and its economic impact. Indeed, the 10-year UST yield dipped further below 1.0% on March 3 after the Fed’s 50 bps emergency rate cut. Over the longer term, it depends on whether the COVID-19 impacts will be deeper or more prolonged than currently anticipated, or if the impacts will turn out to be more moderate, leading to a quick recovery to investor confidence and global growth.
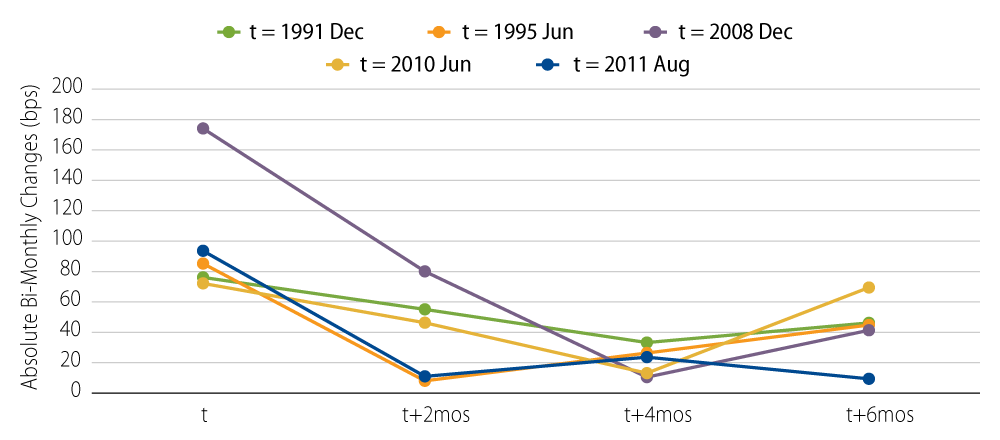
The next relevant question is how long this short-term rate volatility is likely to last, assuming that Jan-Feb 2020 was already a peak in volatility this time. To answer that, we look at historical data again. Exhibit 2 shows the historical path of absolute changes (another simple measure of volatility) for each of the last five extreme moves in the 10-year UST yield. By definition, volatility will only go down from the peak. From historical experience, it usually takes two to four months for volatility to return to its long-term average (38 bps bi-monthly volatility in the case of the 10-year UST yield).
While examining past market behavior won’t necessarily help us foresee the future, it can be very valuable to frame current events into a historical context from which we can more confidently face the current shock and address its impact.