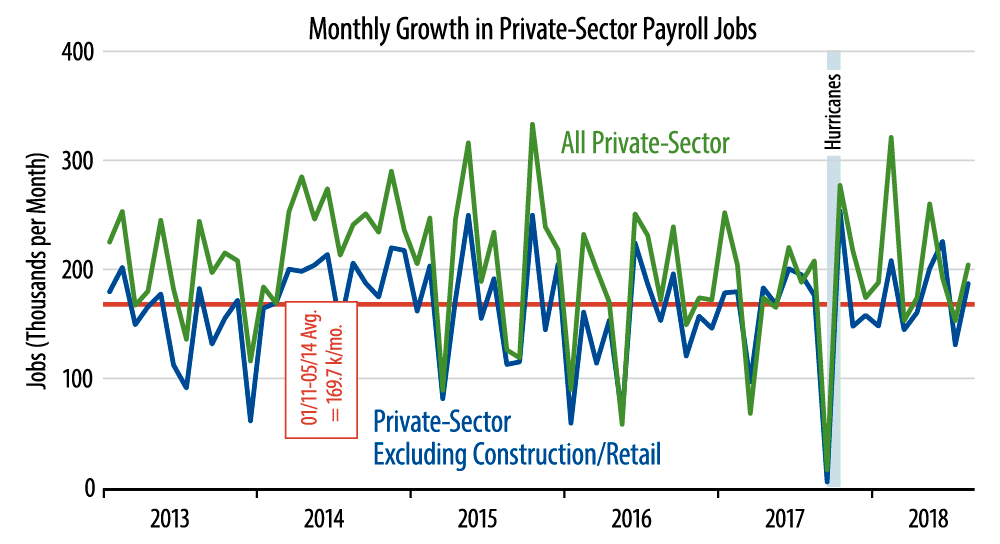
As the chart indicates, our preferred measure has tended to grow by 170,000 per month over recent years, so the August gains were above average, but other months’ performances have not been as strong. Thus, over the last 12 months, including August, this measure has seen average growth of 164,000, less than the average of preceding years.
As is also clear from the chart, there has been no detectable acceleration in job growth—headline or preferred—in the last year plus. One can debate whether or not we are at full employment, but accelerating economic growth requires accelerating job growth, and we have not seen that. So, strong or not, labor market data are not consistent with a thesis that the economic growth has improved since 2017.
Our preferred jobs measure excludes construction and retailing—not because they don’t matter, but because they are especially volatile in the short-term. In August, retailing declined slightly (-6,000, with -25,000 of revisions to July), while construction rose nicely (+23,000, with -6,000 of revisions). Over the longer-term, neither of these sectors has been an impetus nor drag on overall job growth, with both construction and retailing job growth generally steady for the last 18 months, at average rates of 19,000 and 1,000, respectively.
Wage growth was a bright spot in today’s report, with both all-worker and production worker average hourly wages showing nice gains, 0.4% and 0.3%, respectively. We think the production worker measure is more reliable, as it measures hourly wages for workers who actually are paid by the hour. It has risen 2.8% over the last 12 months, compared to 2.3% growth over the preceding 12 months.
Manufacturing jobs declined by 3,000 in August, with -31,000 of revisions to July. Manufacturing has been the bright spot for the US economy over the past two years, but today’s jobs news tags along with recent data on factory orders and output to possibly portray some slowing there, though it is premature to say so for sure.