
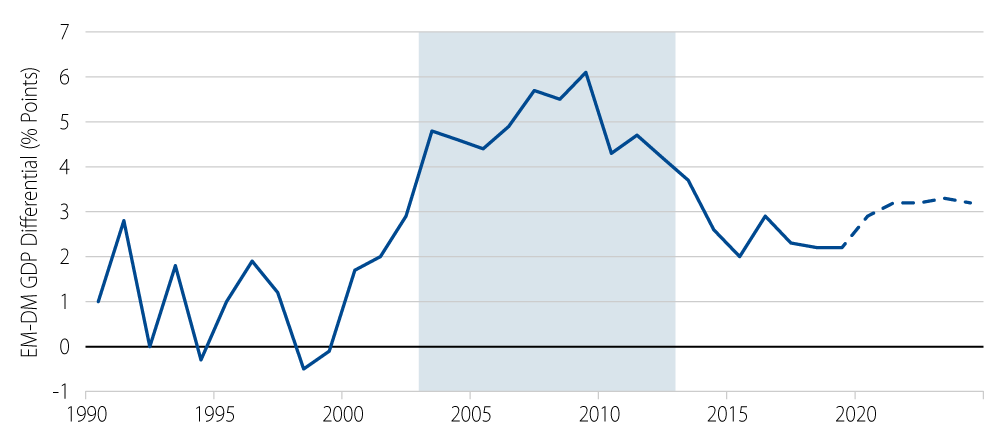
A longstanding theme of emerging markets (EM) investing is premised on supportive secular factors. In the decade prior to the Fed Taper Tantrum of May 2013, EM assets had enjoyed an uninterrupted episode of robust performance. During this period, USD-denominated sovereign debt returned a handsome 9.5% per annum, while local currency government debt posted an eye-popping gain of 11.4% per annum, according to the JPMorgan EMBIG and GBI-EM indices. What was the critical impetus that helped EM debt to assert itself as an asset class? A glimpse into global growth dynamics offers an interesting insight. It is no coincidence that, during this time, average GDP growth in EM was consistently well ahead of that in developed markets (DM). At the peak, EM growth (+2.8%) outpaced DM growth (-3.3%) by a record six percentage points in 2009 (Exhibit 1). By contrast, the growth differential in the 1990s had been distinctly modest and uneven.
Our view is that the EM love fest owed largely to one-off catalysts amid global trade liberalization. Specifically, we believe China’s accession into the WTO in late 2001 had a pivotal impact in propelling the rapid pace of industrial expansion globally. The ripple effects from the infrastructure build-out in China were felt the most among EM commodity exporters, especially in Latin America. With cross-border investments in China tightly regulated, portfolio flows in search of proxy trades for the Chinese growth story redirected to EM. Given the growth-led improvement in credit profiles, EM countries were able to extend their debt maturity profile and reduce external vulnerability with more local currency issuance. Indeed, inflows to onshore markets in EM were significant enough to justify the launch of EM local currency bond indices in 2005. Figuratively speaking, the market episode is akin to “rising tides lifting all boats.”
In the absence of new catalysts, the secular backdrop will play a less pivotal role in driving EM asset prices henceforth. Performance of EM assets in recent years has been decidedly more volatile, reflecting a less conducive global backdrop given escalating risks on geopolitics and trade. At the same time, as secular trends in EM continue to evolve, their influence on markets has become less straightforward. Perhaps the most significant change is China’s maturing growth trajectory, pointing to a permanent downshift from double-digit rates previously to projections of less than 6% in 2020. No other large EM economy is close to replicating China’s growth feat. Quite the opposite, many EM countries are facing the same socioeconomic challenges as their DM counterparts, including aging demographics, income inequality and immigration issues. Adding further technical pressure to EM countries is the progressive inclusion of China in widely-used benchmarks. China now competes directly with other EM countries for portfolio capital.
It follows that global EM investors must pay ever more attention to short-term cyclical factors. While long-term fundamental analysis remains a critical pillar of the investment process, an appreciation of cyclical and technical drivers is now more critical than ever, especially given the boom-bust nature of EM assets from time to time. This leads us to at least two considerations as it relates to EM investing—differentiating individual credits and navigating global crosscurrents. On the first, the heterogeneous nature of the asset class will likely bear out more prominently in terms of performance within the mix of benchmark countries which now number over 75. On the second, managing short-term risks and tactical shifts—currency hedging in particular—could help limit fluctuations in asset values and the volatility of total returns. Customized EM strategies developed in close collaboration with investors and that seek to navigate the unique vagaries of the asset class (e.g. fixed maturity portfolios), may enhance our ability to achieve desired risk-return objectives.
The encouraging news is that the EM-DM growth differential is set to widen once again as we head into 2020. One major stumbling block on EM has been a persistent macro theme of US outperformance. EM growth is poised to accelerate to a three-year high of 4.6% in 2020, based on the latest IMF forecasts. With the exception of China, most core EM economies are expected to stage a rebound, thanks to aggressive policy easing by EM central banks as well as reduced US-China trade tensions. Of note is the abatement of inflation risk across EM countries. Indeed, valuation wise, real yields in EM remain compelling, currently averaging roughly 170 bps above those in DM. From a technical perspective, we do not view EM as excessively over-owned, as compared to the period heading into the taper tantrum.
Our EM convictions center on select EM countries with strong fundamentals and institutions, where structural reforms and policy flexibility should pave the way for a growth bounce. The focus list centers on high-grade countries including Indonesia and Russia as well as select credits in the growing Gulf sovereign complex. In crossover strategies, EM credits offer diversification appeal when compared against “quasi risk-free” valuations in DM credits. To be sure, the overriding macro uncertainty is renewed pressure on EM growth if trade tensions escalate. As it relates to the US economy, a repeat of the significant growth outperformance versus EM we experienced in 2018, which could prompt tighter Fed policy, would be damaging to EM. Conversely, a hard-landing scenario in China, while still a low-probability event, could nonetheless lead to a re-pricing of EM risk premium. Further, escalating social unrest as well as heightened geopolitical events are ongoing risks that bear close monitoring.