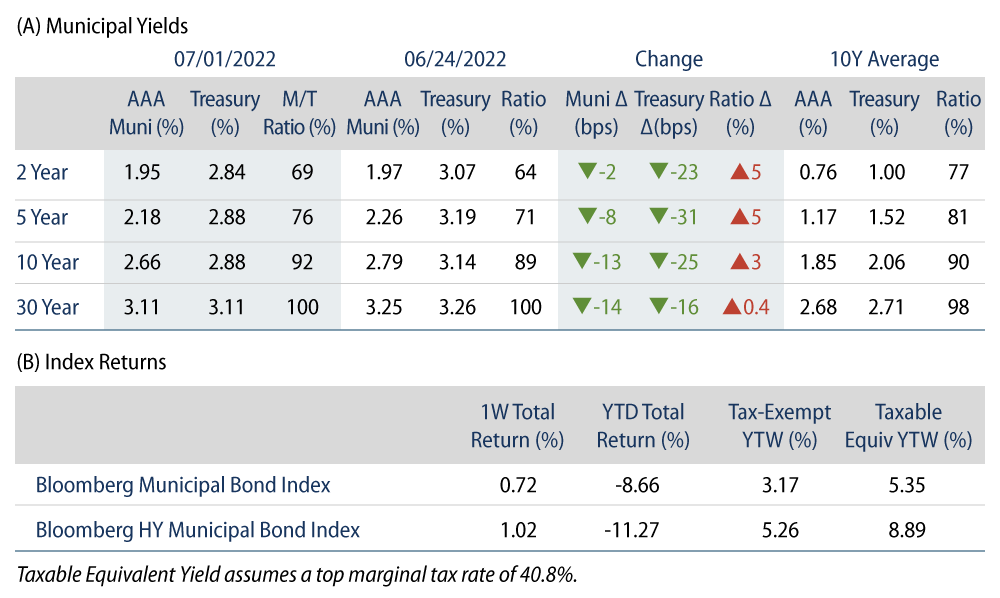
Municipals Posted Positive Returns Last Week
Municipals posted positive returns last week and municipal mutual fund outflows extended a record pace. High-grade municipal yields moved 2-14 bps lower across the curve. Munis underperformed the US Treasury (UST) rally in most maturities. The Bloomberg Municipal Index returned 0.72% while the HY Muni Index returned 1.02% As we close out the first half of the year, this week we summarize 1H22 performance, technicals and fundamental trends.
This Week in Munis: Mid-Year Report
Performance
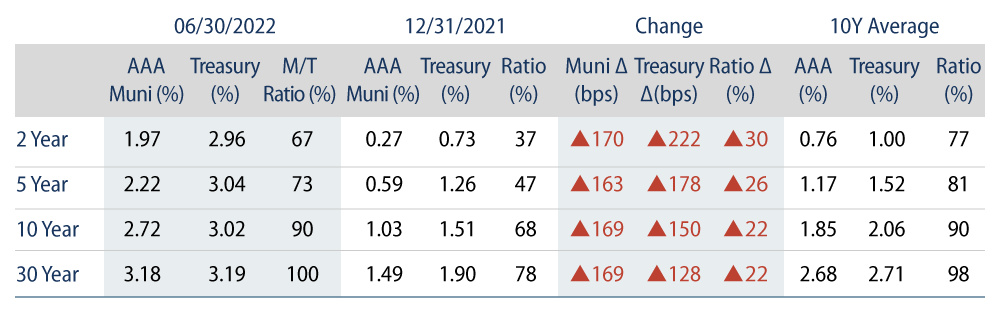
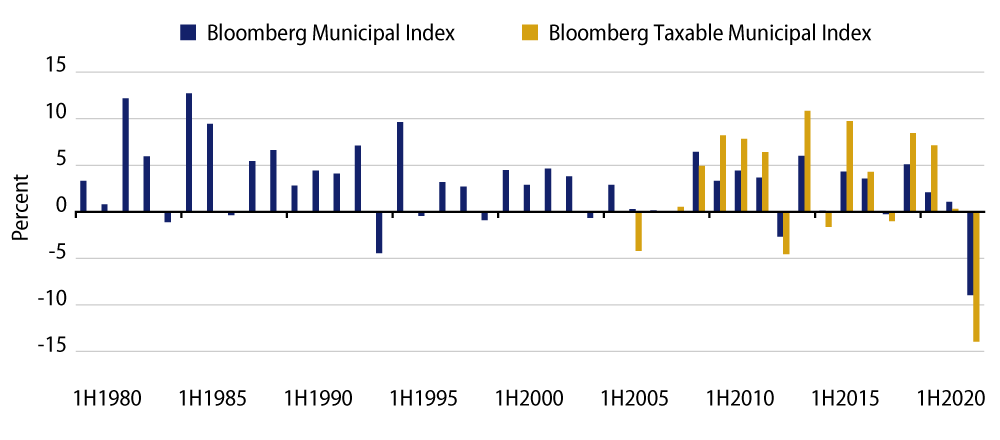
Municipals closed the first half of the year with record negative returns. Through the first half of the year, tax-exempt municipals posted the worst total return on record, declining -9.0% amid elevated inflation and interest rate volatility. Despite the record drawdown, tax-exempt municipals fared better than the US Treasury Index, which returned 9.1% during the first half of the year.
The Bloomberg Taxable Municipal Bond Index also posted a record negative first half return of -14.0%. This decline was generally in-line with other major taxable indices, modestly underperforming the Global Aggregate Index (-13.9%), but outperforming the US Corporate Index (-14.5%).
Curve Returns: Longer duration municipals underperformed the broader municipal market as UST rates rose approximately 120-230 bps across the curve through the first half of the year. 15-year, 20-year, and 22+ year indices returned -10.7%, -11.6% and -14.7% respectively, while 1-year, 3-year and 5-year indices posted returns of -1.2%, -3.5%, and -5.5%, respectively.
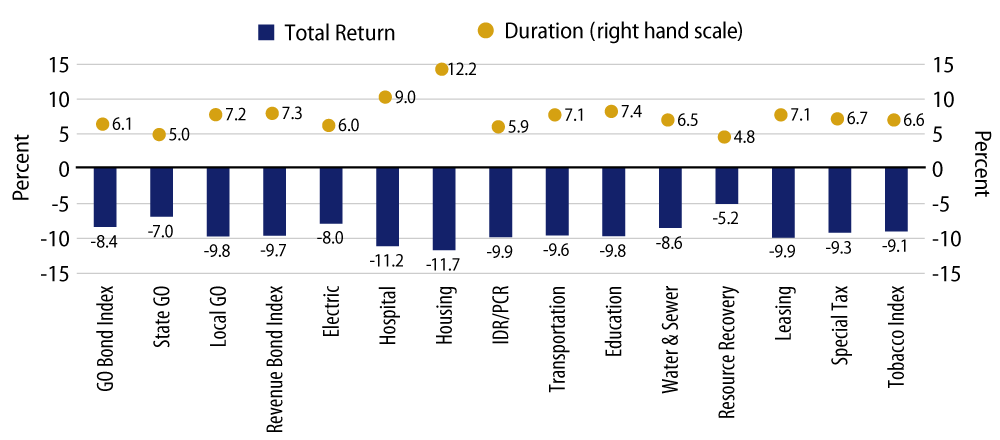
Sector Returns: From a sector perspective, general obligation (GO) bonds returned -8.4%, outperforming their revenue bond counterparts (-9.7%). However, sector performance year to date (YTD) was largely driven by duration of the municipal subsectors. The Resource Recovery sector had the highest return (-5.2%), but the shortest relative duration (4.0 years), where the worst-performing housing index (-11.7%) maintained the longest duration (12.3 years).
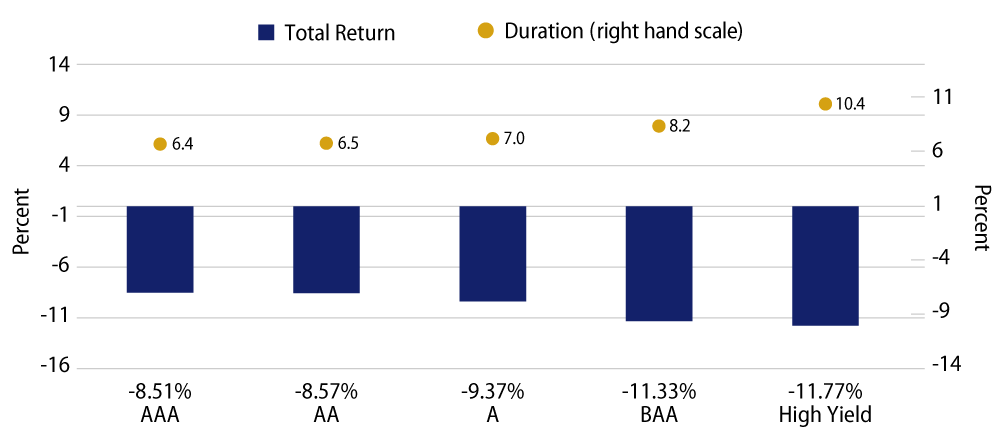
Quality Returns: Reversing trends from 2021, higher quality municipals were the best performers in the first half of the year, with AAA, AA, and A indices returning -8.5%, -8.6% and -9.4%, respectively. These better-performing quality indices maintained shorter duration than the lower quality counterparts. Notably, high-yield municipals underperformed BBB municipals by just 44 bps, despite more than 2.0 years of duration, indicative of spread tightening and the limited trading of the high-yield market.
Weak Technicals Persisted, Contributing to Negative Performance
- Record Outflows. Negative municipal performance has been exacerbated by retail-driven mutual fund outflows. In the 25 weeks through June 29, Lipper reported mutual funds recorded $76 billion of outflows, marking the greatest outflow cycle in recorded history, surpassing the $69 billion outflow cycle in 2013 that spanned 42 weeks.
- Supply Declines. A spike in rate volatility has slowed total muni issuance. Total issuance of $201 billion declined 10% from 1H21. Total supply declines were driven by lower levels of taxable issuance as taxable issuance declined 39% year-over-year to $40.5 billion, while tax-exempt supply increased 2% YoY to $160 billion.
Credit Fundamentals and Outlook
Municipal fundamentals continued to benefit from economic reopenings across the US, driving improving employment and wages. According to the US Census Bureau, major state and local revenues (property, income, and sales tax) reached $1.9 trillion over the prior four quarters of data ending in March 2022, up 16% from the prior record-setting level in March 2021.
Robust revenue collections have provided bandwidth for states and local governments to pursue a variety of initiatives within their budgets. Most municipalities have increased rainy day funds and reserves. We have also observed issuers with historically higher debt burdens de-lever outstanding debt and make higher pension contributions. All told, the improved credit conditions contributed to a trend of upgrades that have surpassed downgrades during the first two quarters of the year.
As the Federal Reserve (Fed) raises rates to combat inflation and domestic growth moderates, Western Asset expects state and local revenue growth to stagnate. However, considering record reserve balances combined with pandemic support that can be allocated through 2026, we believe municipalities are in a strong position to manage through economic volatility. Issuers’ revenue diversity, strong budgeting practices and prudent reserves will be key to sustain credit strength in the next economic cycle.
Despite recent mutual fund flow volatility, heading into the summer months, we expect market technicals to remain buoyed by limited new issuance, along with seasonally high principal and coupon reinvestment.
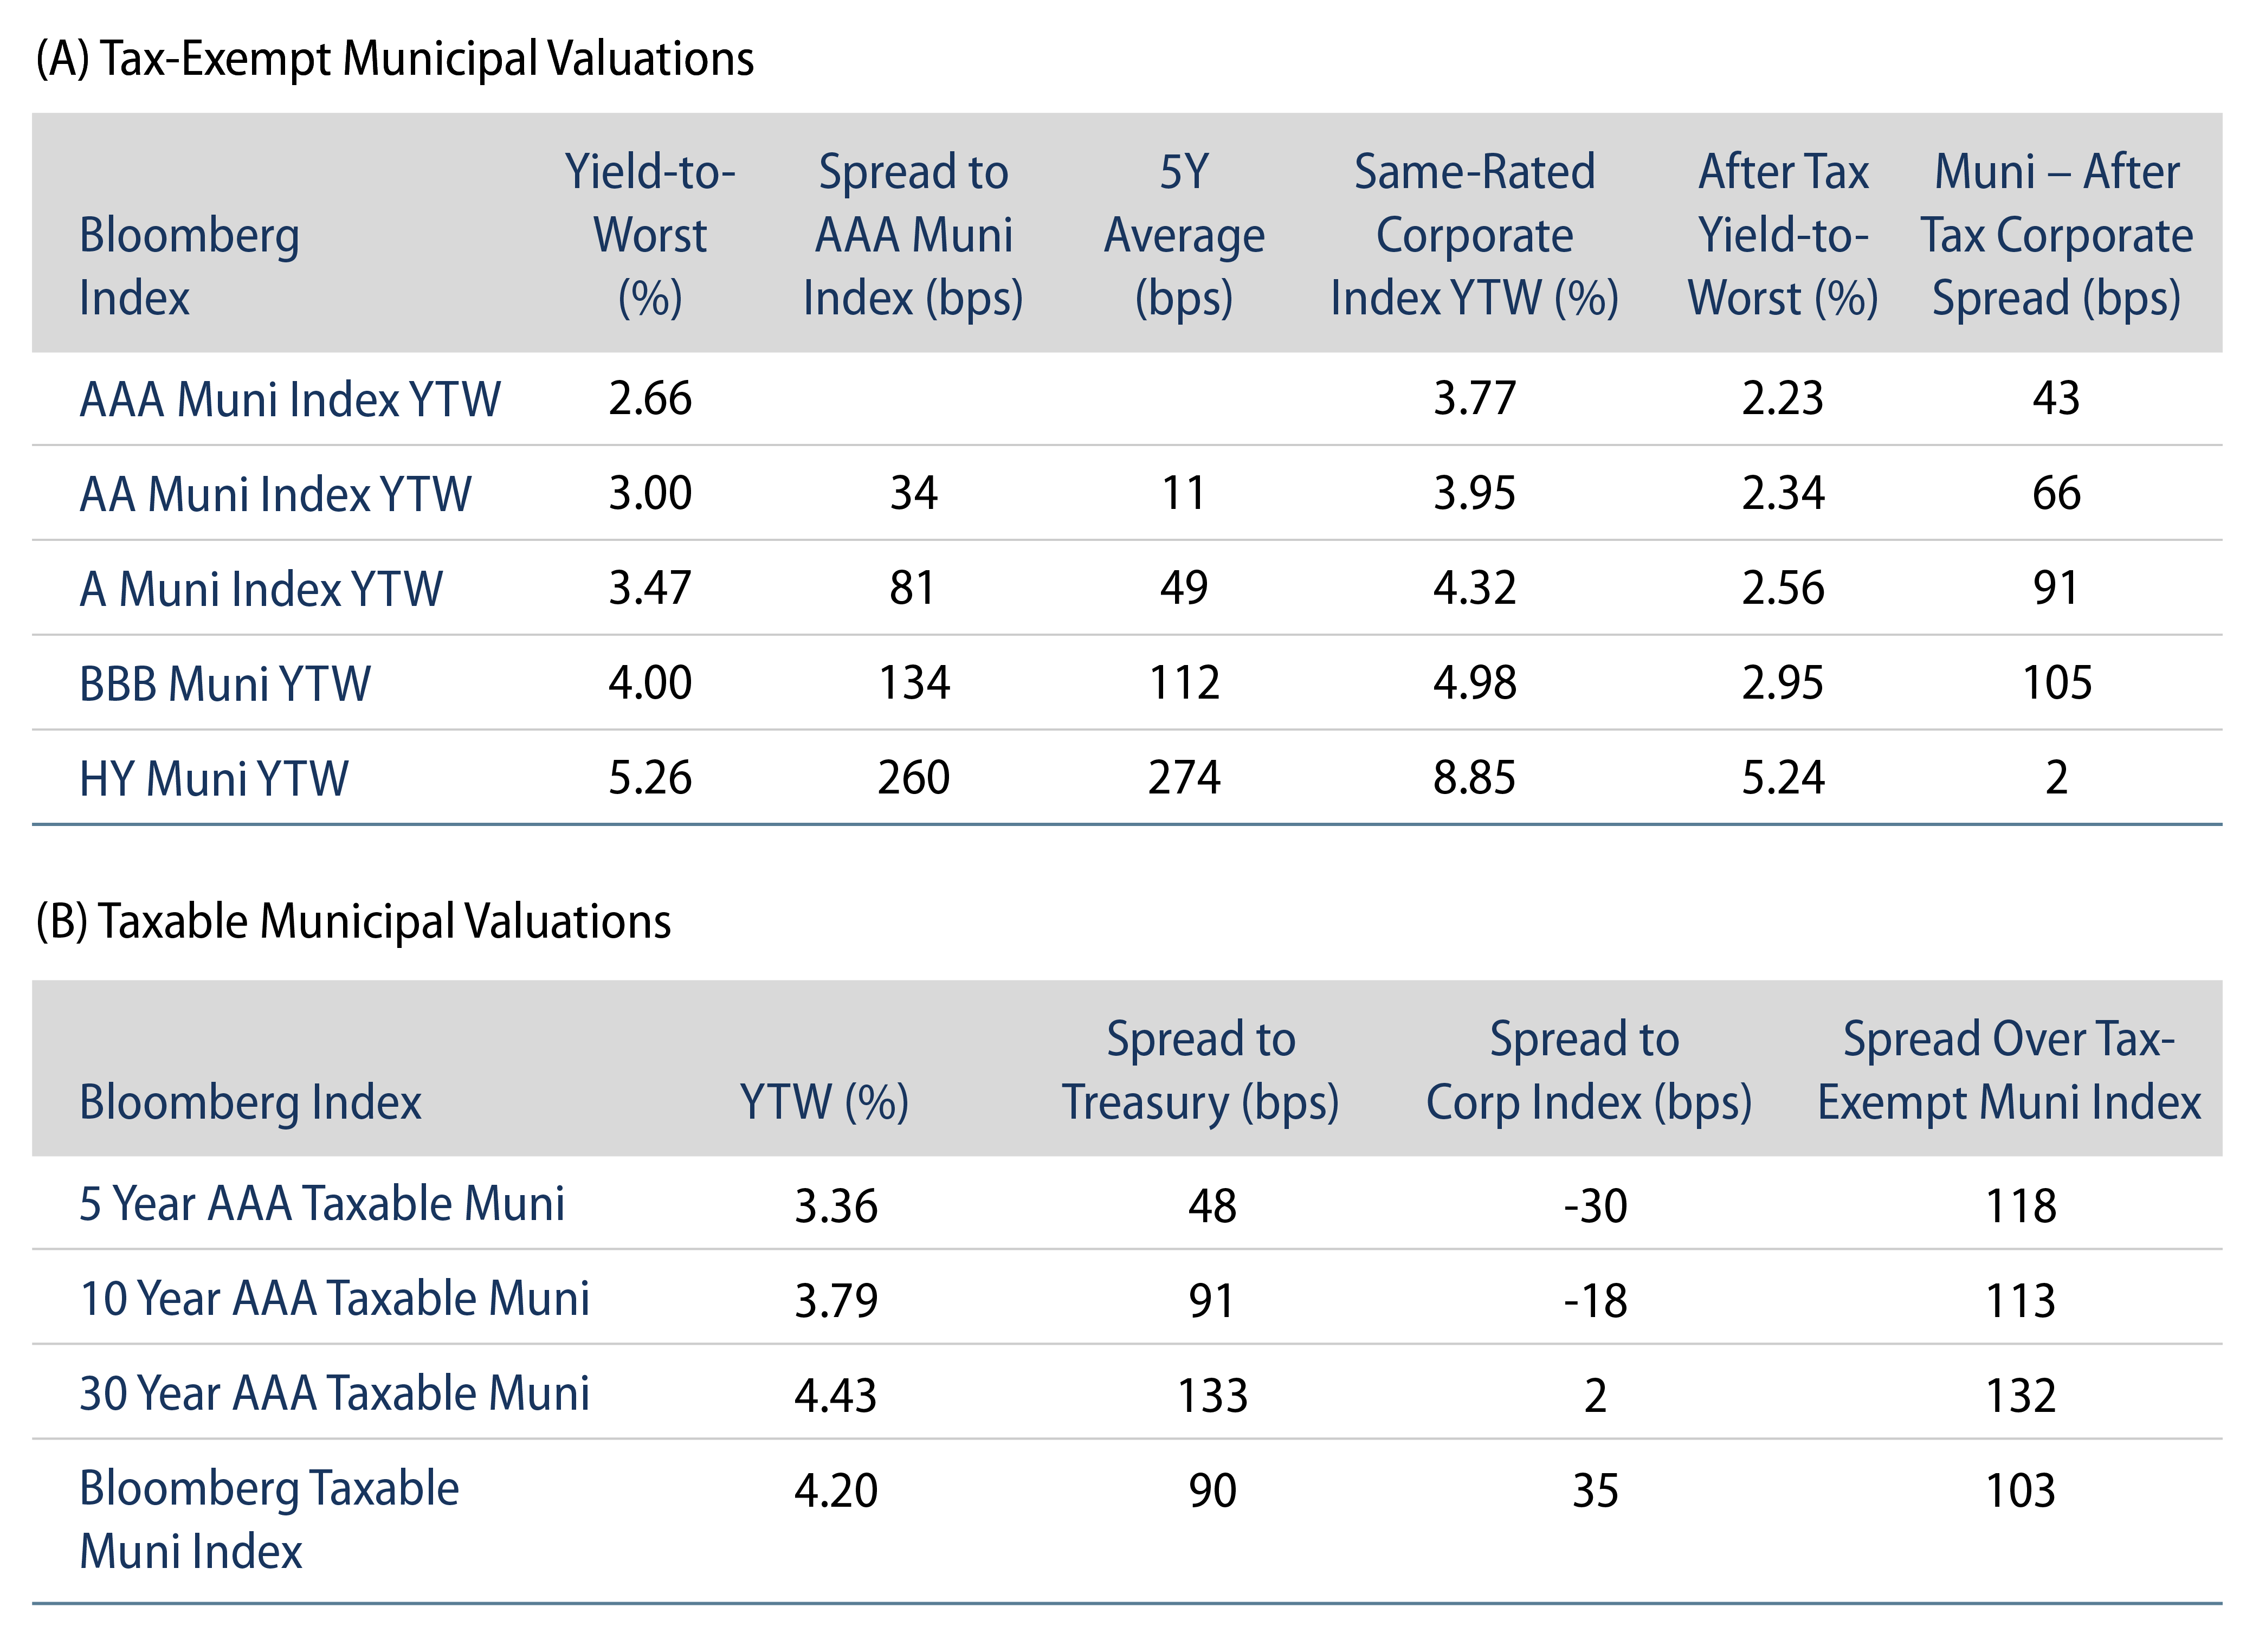
While market volatility challenged YTD municipal performance, it has also reset relative valuations of municipals versus other asset classes. The after-tax yield pickup between municipals and other high-grade fixed-income asset classes has moved from negative levels at the end of 2021 to above five-year averages. While an uncomfortable year for municipal bondholders thus far, we believe it is important to recognize that we experienced comparable maximum drawdowns before. And, while the past does not predict the future, we have previously seen drawdowns more than offset by comparable rebounds that have contributed to a longer-term favorable value proposition of the asset class.