Municipals Were Relatively Unchanged During the Week
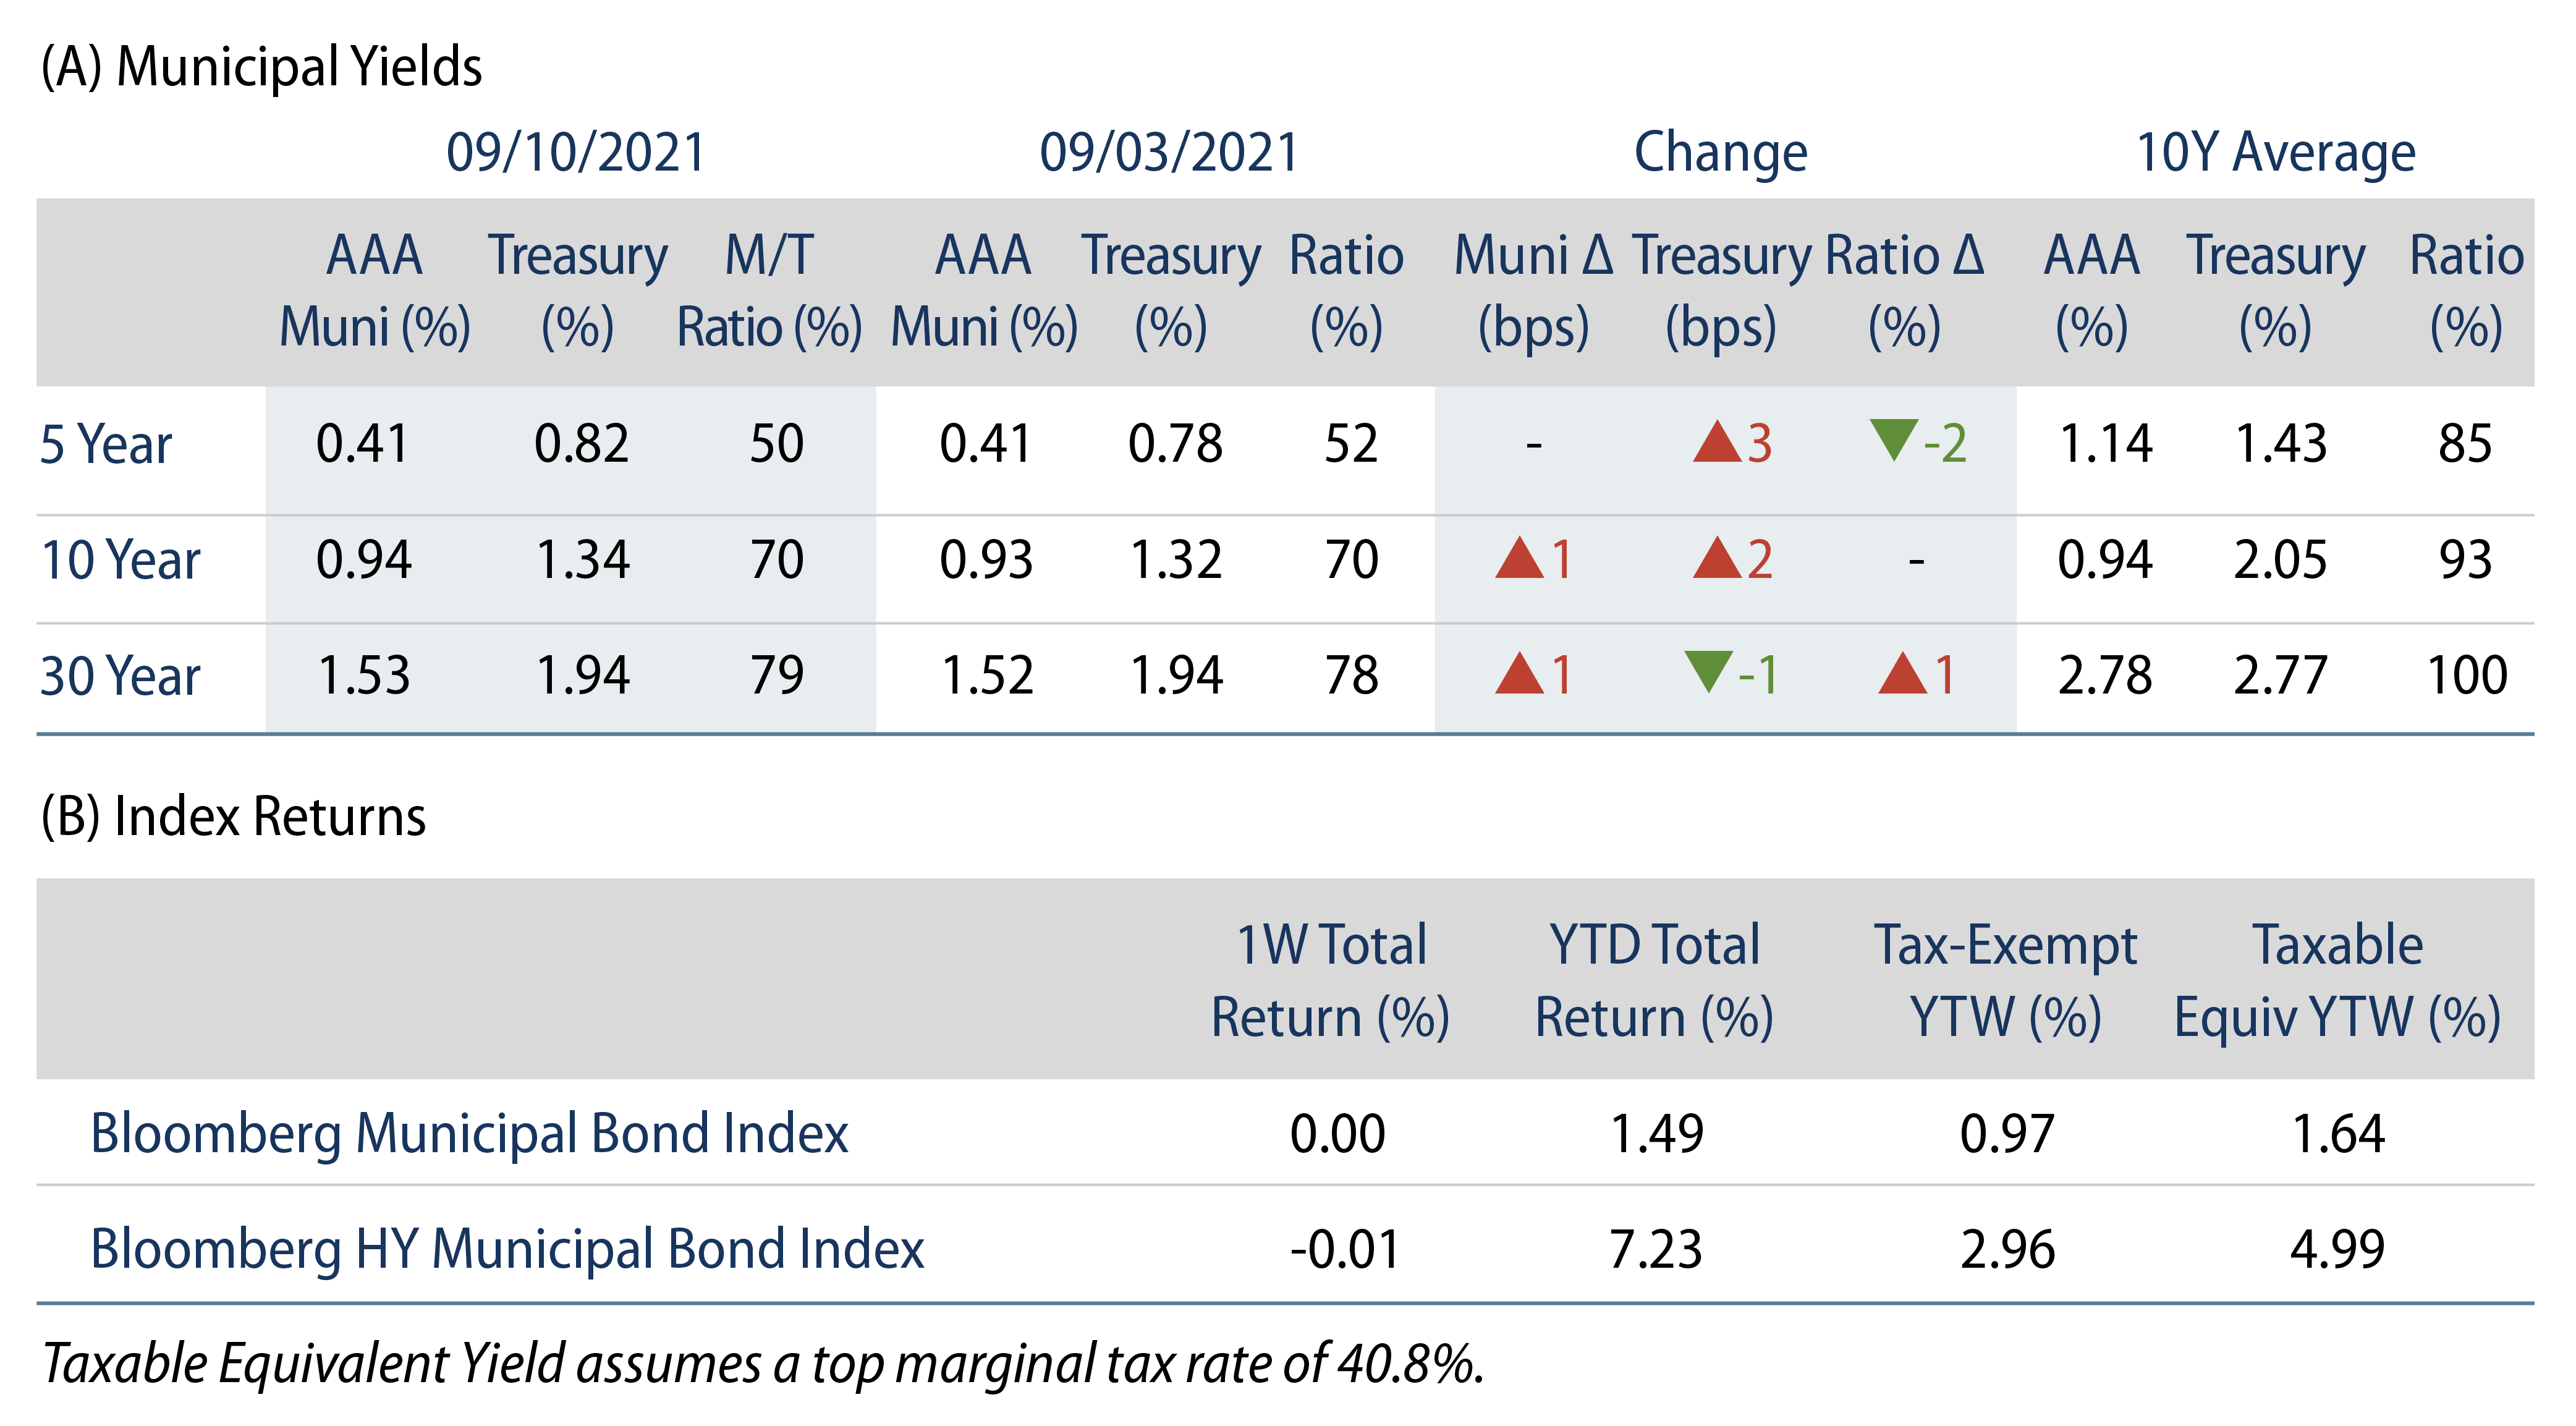
US muni yields moved 1 bp higher in intermediate and long maturities. Munis outperformed Treasuries in short maturities but underperformed in long maturities. The Bloomberg Municipal Index returned 0.00%, while the HY Muni Index returned -0.01%. Technicals remained strong as flows continued at a record pace while supply was limited over the holiday-shortened week. This week we evaluate the impact of near-record low trading volumes in the municipal market.
Municipal Supply and Demand Technicals Remain Strong
Fund Flows: During the week ending September 8, municipal mutual funds recorded $1.1 billion of net inflows. Long-term funds recorded $691 million of inflows, high-yield funds recorded $145 million of inflows and intermediate funds recorded $677 million of inflows. Municipal mutual funds have now recorded inflows 68 of the last 69 weeks, extending the record inflow cycle to $147 billion, with year-to-date (YTD) net inflows also maintaining a record pace of $85 billion.
Supply: The muni market recorded $7.8 billion of new-issue volume during the week, up 52% from the prior week. Total issuance YTD of $313 billion is 4% higher from last year’s levels, with tax-exempt issuance trending 12% higher year-over-year (YoY) and taxable issuance trending 18% lower YoY. This week’s new-issue calendar is expected to increase to $12 billion of new issuance. The largest deals include $2 billion State of California General Obligation and $805 million Black Belt Energy Gas District transactions.
This Week in Munis—Secondary Trading Volume Suppressing Volatility
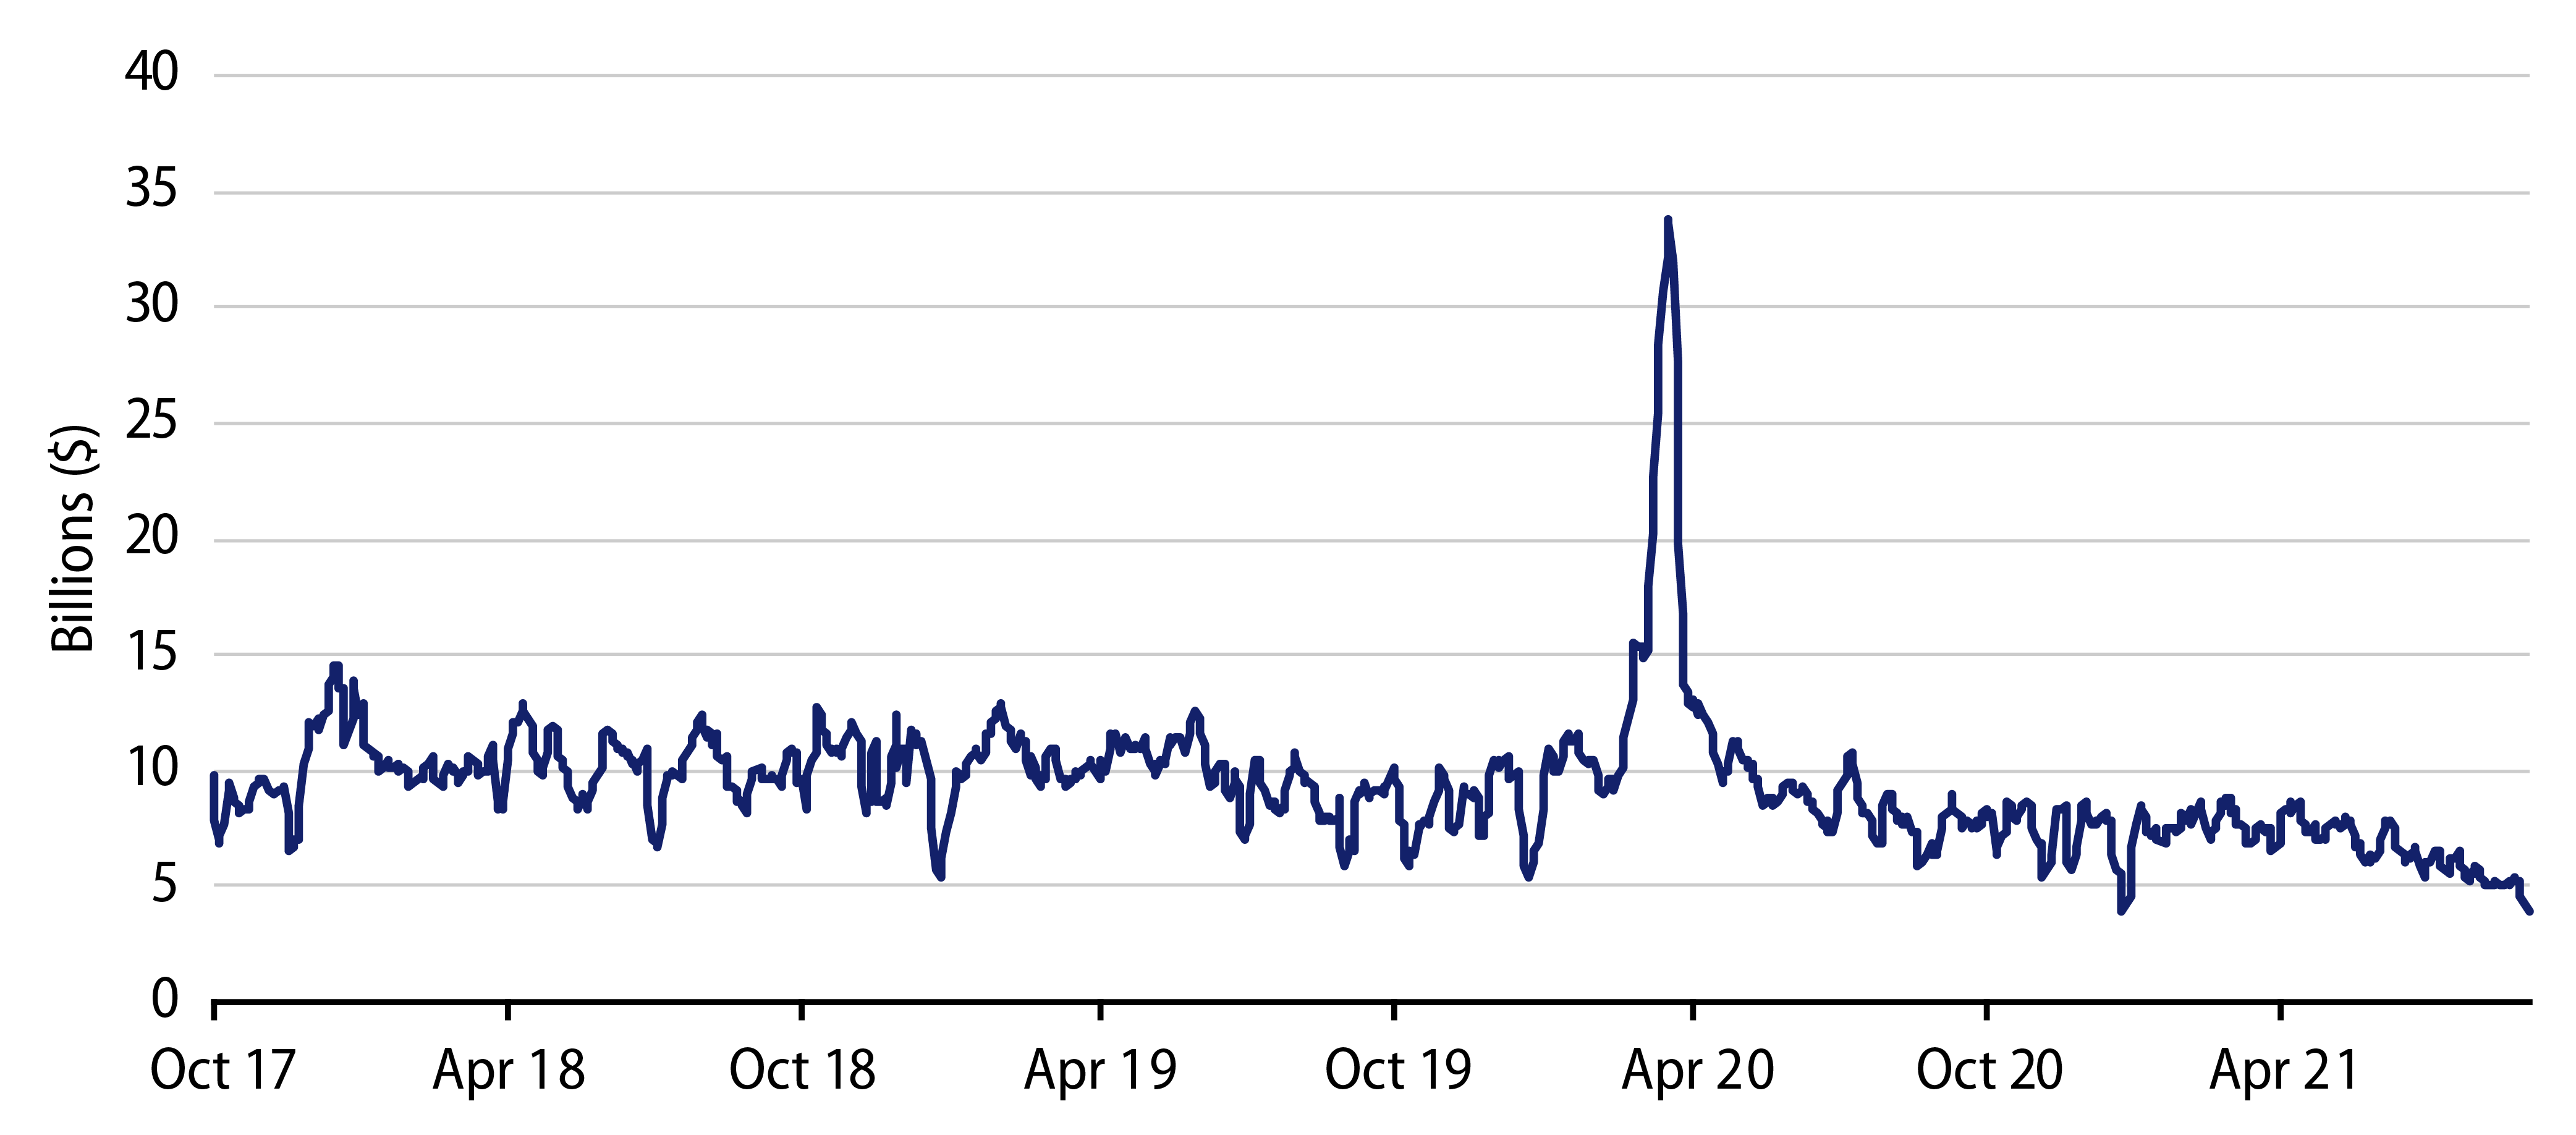
Last week, municipal secondary trading volumes dropped to a near-record low, falling below $5 billion. In addition to seasonally quiet trading activity that typically takes place over the summer, near-record low muni yields combined with record flows into the asset class have suppressed municipal trade volumes. We surmise that most muni managers, flush with new capital from the record mutual fund inflow cycle, are hard-pressed to sell existing holdings while challenged to allocate new capital at relatively tight spread levels.
Low trading volumes can further limit price discovery in a fragmented market where price discovery is already challenging. In the 12 months ending August 31, 2021, only 32% of the outstanding 953,000 municipal CUSIPs were traded. Limited trading volumes are particularly acute in the high-yield muni market, where 58% of the 5,128 Bloomberg’s high-yield municipal constituents did not record a trade from March 31 to September 9, 2021.
Limited trading volume and price discovery dampens volatility metrics observed by investors, highlighted by the volatility of the less-frequently traded municipal high-yield market. This year, the Bloomberg Muni High Yield index observed lower volatility than the higher quality, more liquid Bloomberg Aggregate and Bloomberg Treasury indices.

While often relied on as a measure of risk, we do not believe the current muted volatility adequately reflects the credit risk of the underlying assets (municipal high-yield maintains higher default rates than Treasuries and investment-grade credit), nor does it reflect the potential volatility the index could face if underlying assets were more frequently traded. During the pandemic-driven rush to liquidity that took place in March 2020, daily municipal secondary trading activity reached approximately 7x current levels ($42 billion), and the 20-day volatility metric of the Bloomberg High Yield Index quickly reached a high of 42%, whereas the volatility of the Bloomberg Aggregate Index was just 14% and the Treasury Index was just 18%.
In navigating these municipal market pricing dynamics, we believe analytic and risk management resources are critical, particularly in environments where volatility is muted. As we seek to deliver risk-adjusted value to clients, Western Asset maintains independent pricing capabilities and proprietary risk systems that allow us to incorporate these stress scenarios into our asset allocation decisions.