Today’s news included benchmark revisions to past years’ growth and the introduction of a new base year. That is, previous real GDP estimates had been estimated in terms of 2009 dollars, but the new data feature a 2012 base year. The incorporation of new source data into the estimates saw average growth in 2016 rise from 1.8% to 1.9%, while average growth in 2017 was changed from 2.6% to 2.5%. Growth in 1Q18 was revised from 2.0% to 2.2%.
Estimates for 2Q18 growth had clustered around the 4% mark or higher ever since foreign trade data had shown big improvements over March-May and retail sales showed a sharp gain in May. Advance data on June foreign trade showed some pullback from those gains, and retail sales, similarly, showed less of a buoyant gain in June. Still, the gains through May were enough to power the best quarterly gain since 2014.
2Q18 GDP growth would have been even stronger but for a big drag from inventory investment, although our guess is that the decline in inventories was the "flip side" of an improvement in foreign trade that likely caught merchants by surprise. So, we could well see some inventory rebuilding in the second half of the year…which will likely be offset by a return of the foreign trade balance to its deteriorating trend.
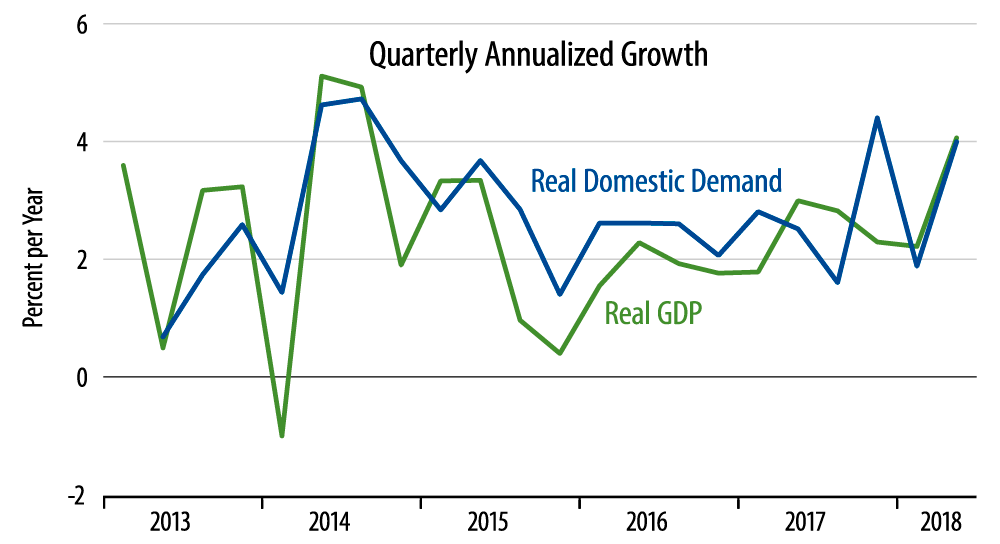
We have been skeptical of proclamations of booming US growth, as we thought the above-3% GDP readings in mid-2017 were driven by "one-time" factors and that basic domestic demand in the US had not shown convincing signs of acceleration. The accompanying chart compares growth in GDP versus domestic demand, and you can see that demand growth had not shown any acceleration until that spike in 4Q17 driven by early Christmas shopping. Demand growth fell back to ground in 1Q18, but registered a strong gain in 2Q18, thanks again to that May retail sales print. Growth going forward will likely continue to ebb and flow with swings in retail sales and consumer demand.