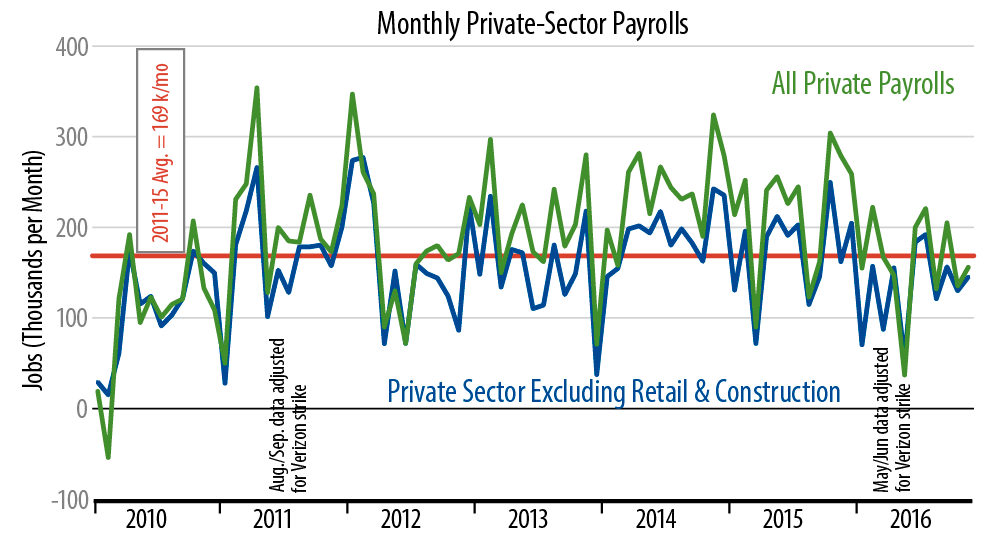
Both of these prints continue the trend of 2016 job growth coming in substantially below the growth rates of previous years. This should be obvious from the accompanying chart, but just to drive the point home, we’ll state that total private-sector job growth so far this year has averaged 162,000 per month, compared to 221,000 and 240,000 per month in 2015 and 2014, respectively. For our core measure, average growth for 2016 to date is 121,000 per month, compared to 173,000 and 193,000 in 2015 and 2014, respectively.
Earlier this week, the ADP survey showed November gains north of 216,000, which raised expectations for a similar, above-200,000 print in the official data. Instead, November job growth was “same old same old.”
Elsewhere in the report, the unemployment rate dropped from 4.9% to 4.6%, but this was mostly due to a decline of 224,000 in the labor force. Job growth in the household survey underlying the unemployment data was only 160,000 in November.
Various inflation buffs had made much of a 0.4% monthly gain in average hourly wages a month ago. November data reversed this, however, with hourly wages declining 0.1%.This dropped the yearly growth rate in this series to 2.4%, right in line with the trend of the last two years.
We have paid special attention to factory data within the payroll release. These showed another decline, as well as a drop in workweeks, suggesting that factory output within the industrial production data will decline again in November.
The drumbeat on Wall Street has been that the economy is picking up, and the post-election financial market moves have only added to this crescendo. We are skeptical that any such growth pickup has actually occurred, and the November payroll data are consistent with our view.