We’ve been less ebullient than the consensus opinion regarding the recent consumption data; today’s news is a case in point. Again, the headline gain was only modest, and a little less than that when revisions are factored in. And there is some disparity between services and goods details.
Consumer spending on goods was up, strongly in line with the July retail sales data. The core goods consumption measure we track, excluding motor vehicles but including restaurants (which other analysts put within services), was up a nice 0.5%, with only a negligible revision to June. However, core services spending, excluding utilities and restaurants, was up only 0.1% (0.14%, to be exact), while June’s total was revised by -0.1% (actually -0.07%), leaving only a 0.1% (0.07%) net gain from last month’s print.
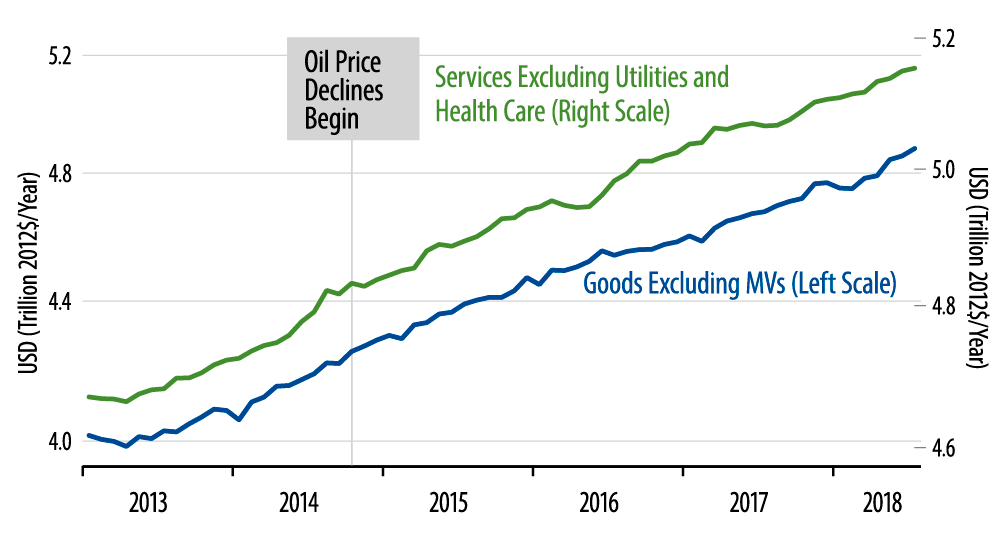
As stated in our installment from August 15, retail sales—thus goods consumption—have risen nicely in May and July, while other months of this year showed only modest gains. Services consumption, meanwhile, has grown only modestly throughout the year. (See chart.) We’re not saying that consumer spending is soft. We’re saying that claims of a consumer spending upturn/acceleration are premature and myopic, focused on goods only—even then only two months out of seven—and ignoring the 60% of consumption accounted for by services. A more apt description of consumer behavior is that it’s shown steady, non-spectacular growth for a number of years.
As for the sectors excluded from the chart, spending on vehicles has sagged over the last three months and been flat for the last three years plus. Utilities spending has held mostly flat over the last two months, after reversing a March/April spike in May. Health care spending continues at a steady pace that is a bit slower than what we saw over 2016-17. None of these sectors are showing markedly different behavior from what we described for the core measures. We exclude them because of their short-term volatility, not because of any disparate movements.