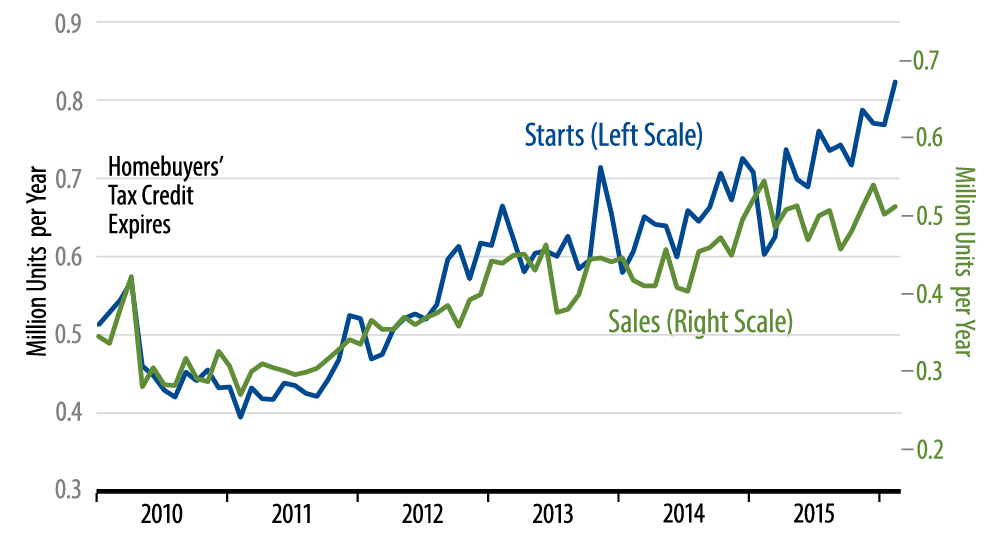
New-home sales rose a slight 2.0% in February. How can a 2.0% gain be "slight"? When it comes on the heels of a 7.0% decline in January and when that February gain leaves sales 5.5% below February 2015 levels. The accompanying chart tells the story very well. New-home sales continued along the flat line path they have maintained since early-2015.
Notice that the flat sales trend stands in stark contrast to ongoing increases in single-family housing starts and homebuilding levels. This is a real paradox in the current housing data. Starts and construction levels indicate a homebuilding market that continues to power up at a substantial rate, thus providing about a 0.2% per year boost to GDP growth. Sales levels, however, indicate a housing market that has topped out.
Some analysts decry the new-home sales data as unreliable. However, when a government-published indicator shows zero growth for a full year, it must be telling us something. Meanwhile, in line with the apparent gap between levels of homebuilding and new-home sales, inventories of unsold new homes continue to pile up, with almost 6 months' worth of sales now available in builders' inventories.
This compares with the 4 months' worth of sales that were generally available in the early-2000s, before the frantic last days of the housing bubble. New-home inventory levels are not now frighteningly high, but they are at levels that homebuilders are unlikely to want to maintain.
We should point out that we have been projecting a topping out in homebuilding activity this year, precisely because we thought builders had gotten production ahead of demand. The housing starts data to date have failed to confirm our expectations. However, the continued sluggishness in new-home sales and the resulting build-up of unsold inventories make us inclined to hold to this forecast a bit longer.