As with other "underlying" measures, we focus on orders excluding transportation to home in on the less volatile components of durable goods orders. Not only are aircraft orders volatile, but also it takes five to six years for an aircraft order to be filled, while orders for other machinery are generally filled within a few months.
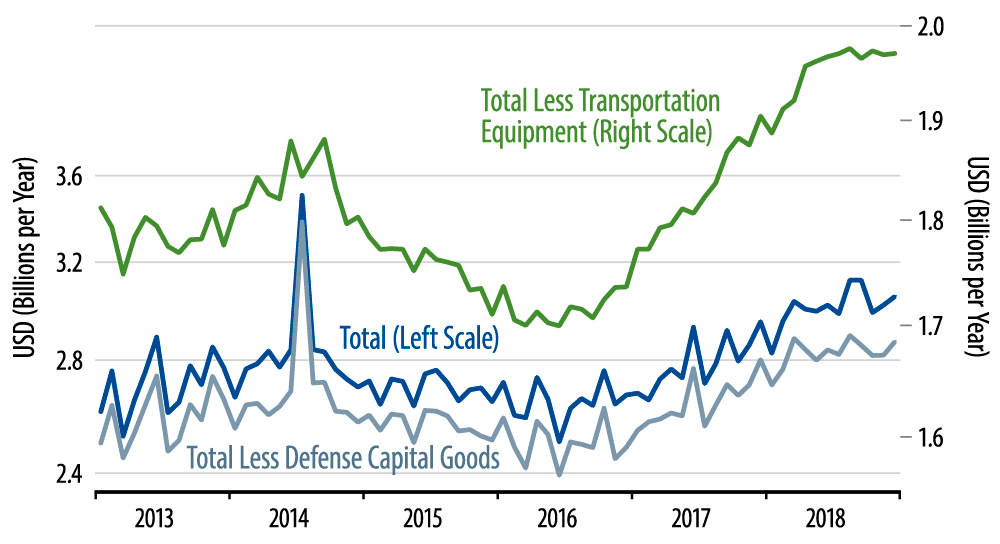
The accompanying chart tells the story nicely. All the durable goods orders measures shown there have been generally flat for the last eight months. Orders "ex trans" (green line) show a generally smooth, flat line over that period, while headline orders show a choppier sequence, though still a flat one on net recently. Notice also that the December increase announced for headline orders only partially offset a large decline estimated for October.
Keep in mind also the effects of the government shutdown on data releases. The Labor Department and Federal Reserve (Fed) were not affected by the shutdown, so we already have January data on factory payroll employment and industrial production, whereas the Commerce Department was shut down, and only today did it produce preliminary data on December factory orders.
The data from those other agencies essentially echo the signals emitted by durable goods orders: after a nice rebound from late-2016 through mid-2018, growth in the factory sector has moderated in recent months. US factory activity still looks better than it did from 2014 through late-2016, but not as good as it looked from late-2016 through early last year. This is the major factor behind our forecast of 2.0%-2.25% 2019 GDP growth, versus the near 3% growth seen over most of 2017 and 2018. And all of this supports the reasoning underlying the Fed decision to halt its rate hike regime.