Those analysts proclaiming “better” economic growth lately will no doubt attribute the January sales declines to extremely cold weather. Indeed, with the January cold spell hitting the South especially hard relative to the past, there is reason to believe the sharp sales declines there are partly weather-related.
Then again, it is equally likely that the “weather” overstated home sales in October and November. That is, the spate of hurricanes hitting the South in August and September clearly depressed sales then, so the spikes in home sales and housing starts in October and November most likely reflect a “catch-up” in housing activity following a hurricane-induced decline in activity earlier.
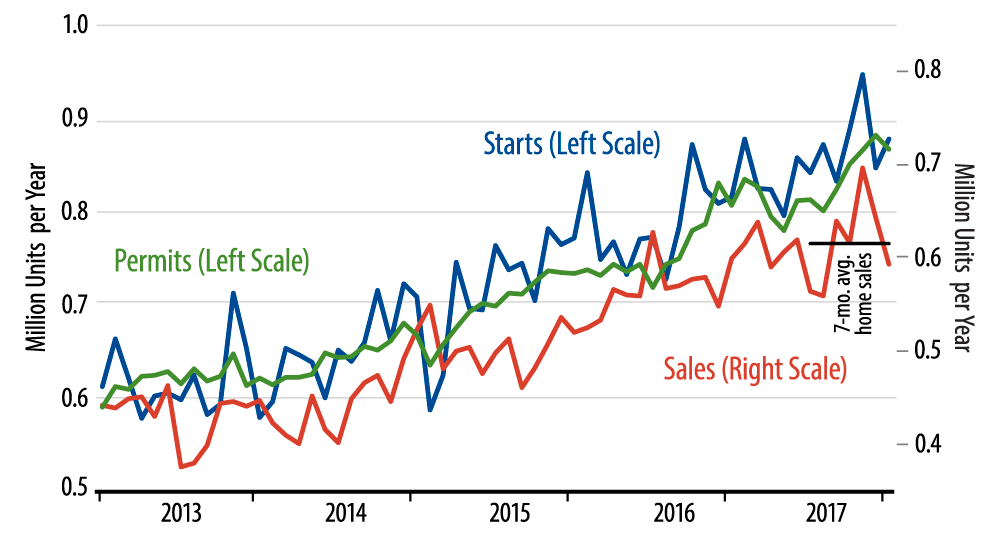
To get an idea of activity levels net of the hurricanes and cold weather, we can take a seven-month average of sales, thus averaging together hurricane-depressed months, post-hurricane boosted months, and the January cold spell. As shown in the accompanying chart, that seven-month average comes in at 615,000 units per year, about the same level as what we saw in the first six months of 2017. In other words, beneath all the weather-related swings, new-home sales look to have stalled over the past year.
It certainly is the case that inventories of unsold new homes have continued to rise over the past year, hitting 6 months’ of sales in January. It is often asserted that home inventories are tight. Those claims ignore the fact that home sales levels are also especially low. The 5- to 6-months’ sales inventories levels of the past year compare to around 4 months’ sales over 1997–2005, before inventories soared in the final months of the housing bubble. So, we take issue with those claims that homes are in short supply.
Meanwhile, data for the month have now come in on the soft side for payroll jobs, retail sales, industrial production and home sales. Maybe it is just the weather…or maybe those claims of accelerating US growth are off the mark.