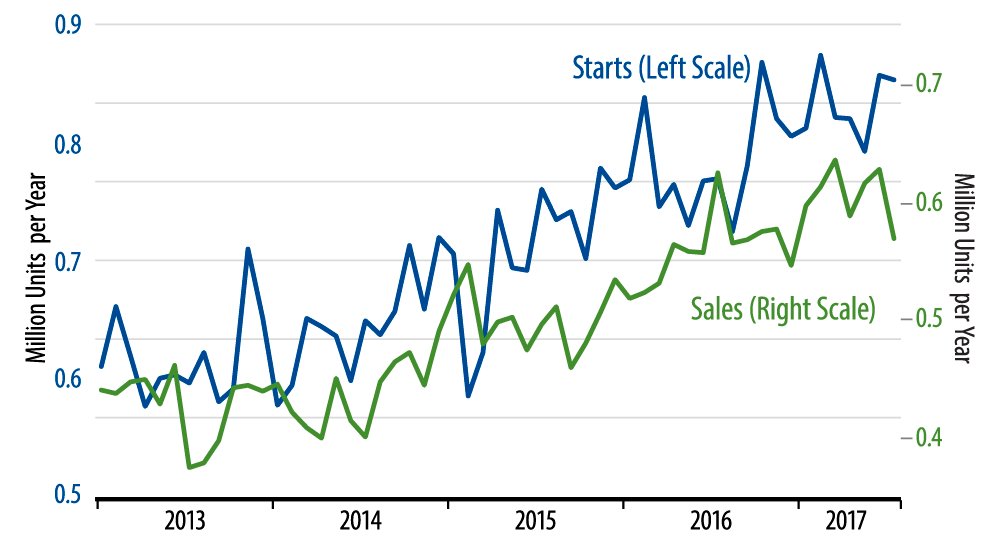
Looking at many months’ worth of data in the accompanying chart, the trend for new-home sales looks flat since January. So, both the sharp May/June increases and the sharp July decline are a lot of sound and fury signifying nothing. The trend for single-family housing starts is similarly flat since last October.
Our expectation has been that homebuilding would be flat to down through the rest of the year, following a nice increase in 4Q16 and 1Q17. The housing data for the last six months are fully consistent with this outlook.
Our focus is on whether homebuilding is rising or declining, because it is changes in homebuilding levels that feed through to changes in construction spending and GDP growth. Wall Street commentary typically fixates on whether homebuilding levels are “high” or “low,” but a flat, “high” level of homebuilding contributes nothing to GDP growth, while a low, rising level can impart a substantial boost. Flat homebuilding through year-end means no second-half contribution to GDP growth from the housing sector.
As for the possibility of homebuilding declines, note from the chart that recent levels of sales are below the levels of starts, at least according to our “construction.” The accuracy of this depiction is attested to by the fact that unsold inventories of new homes have been rising steadily over the past year, a sure sign that the supply of new homes is outpacing demand. New-home inventories are probably not high enough to signal impending problems for homebuilding, but they are high enough that homebuilding could decline slightly in the next few months.