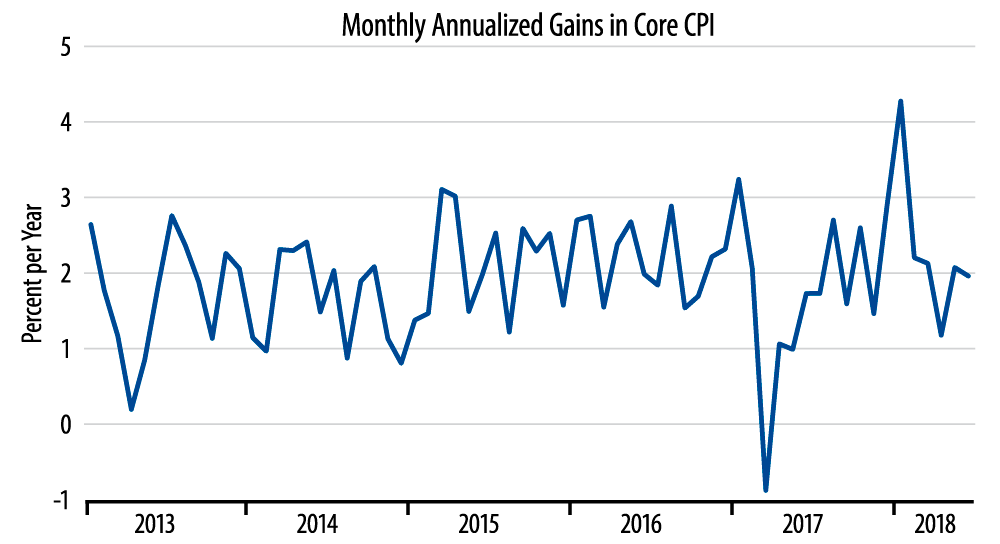
The Wall Street consensus has continued to claim that US inflation is accelerating, and no doubt they will continue those claims on the heels of today’s news. We have disputed that claim, and we offer the accompanying chart as evidence on our behalf. The chart shows monthly annualized rates of changes in the core CPI.
The chart shows data exactly as the BLS reports them, the only "filter" applied being the calculation of compound annualized changes in the monthly data. Judge for yourself. Does this chart really suggest to you an accelerating trend?
We did see an outsize hike in prices in January 2018. 12-month rates of change will continue to include that January 2018 rise for seven more months, so this 12-month rate of change does suggest an ongoing increase. However, note that every month since January has shown an inflation rate lower than the monthly range exhibited over 2015 and 2016.
Inflation waxed especially low in March 2017 and for April and May following. The Street—and the Fed—were quick to deprecate the low inflation then as an aberration, and subsequent experience bears them out on that assessment. In comparison, the January 2018 hike was even more short-lived than the March-May 2017 inflation plunge, and the last five months’ of data have been just as contrasting to the January 2018 inflation spike as late-2017 data were to the March-May 2017 inflation shortfall. Yet there is no outcry—apart from yours truly, it seems—labeling the January 2018 spike as an aberration.
We would concede that the data confirm an underlying inflation rate around the 2% target that the Fed has set. However, our assertion is that the data do not suggest any tendency for inflation to rise past that 2% target.
*BLS reported a 2.3% increase in the core CPI over the last 12 months. That rate holds for unadjusted CPI data. We’ve performed the 12-month calculation a number of times on the seasonally adjusted core CPI data and continue to get a 2.23% 12-month rate.