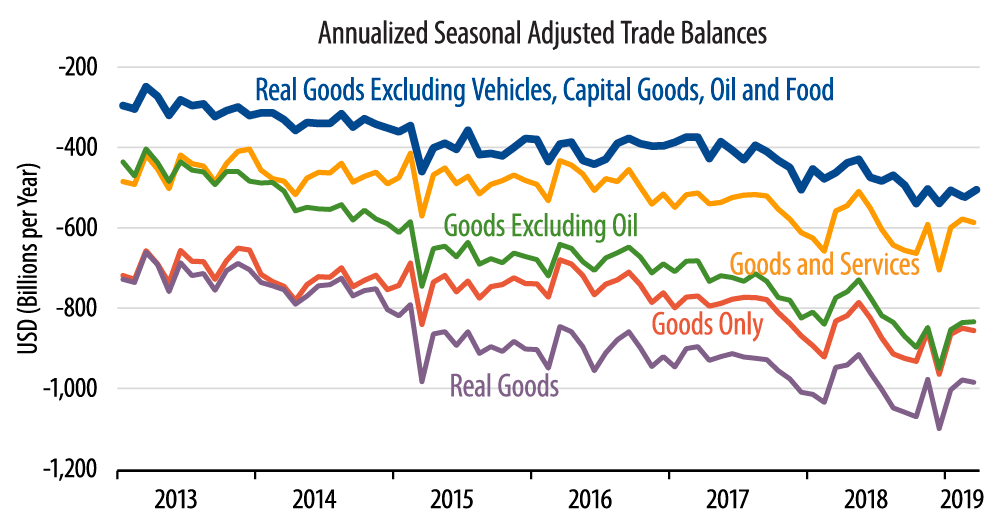
With the foreign trade data even more so than with other economic indicators, context is everything. Thus, for our preferred trade measure, the slight "improvement" in trade came after months of steady deterioration, as can be seen in the blue line in the accompanying chart. In contrast, for the "headline" trade measure, the slight deterioration in the trade balance came after a hefty improvement in January that was furthered slightly in February.
The chart shows five different measures of the trade balance. All of them save one show a noticeable improvement in 1Q19 overall. This improvement added more than a percentage point to 1Q19 GDP growth, and it was the main reason the 1Q19 GDP data showed buoyant growth instead of the soggier performance analysts were initially looking for.
It is telling that the one measure of the trade balance that did NOT show marked improvement, the blue line, is the one we focus on because it abstracts from various flukey elements. In other words, it was the flukey items that drove the 1Q19 trade improvement: sharp "one-off" increases in exports of food, motor vehicles, and capital equipment, alongside declines in imports for each of these.
Net of these items, the trade balance continued its steady deterioration in 1Q19, a downtrend that was only slightly interrupted by today’s March data. Meanwhile, even for the four measures of the trade balance that showed the 1Q19 improvement, it looks clear from the chart that the trend for these measures is downward. Even the 1Q19 gains for these were merely par for the course fluctuations amid an ongoing downtrend.
So, it is likely that the 1Q19 improvement in the trade balance is a random fluctuation that will be reversed in 2Q19 and after. Foreign trade will likely exert an even bigger drag on 2Q19 GDP growth than the boost it provided to 1Q19 growth, since the trade balance would be falling back to a downward trend from currently elevated 1Q19 levels.