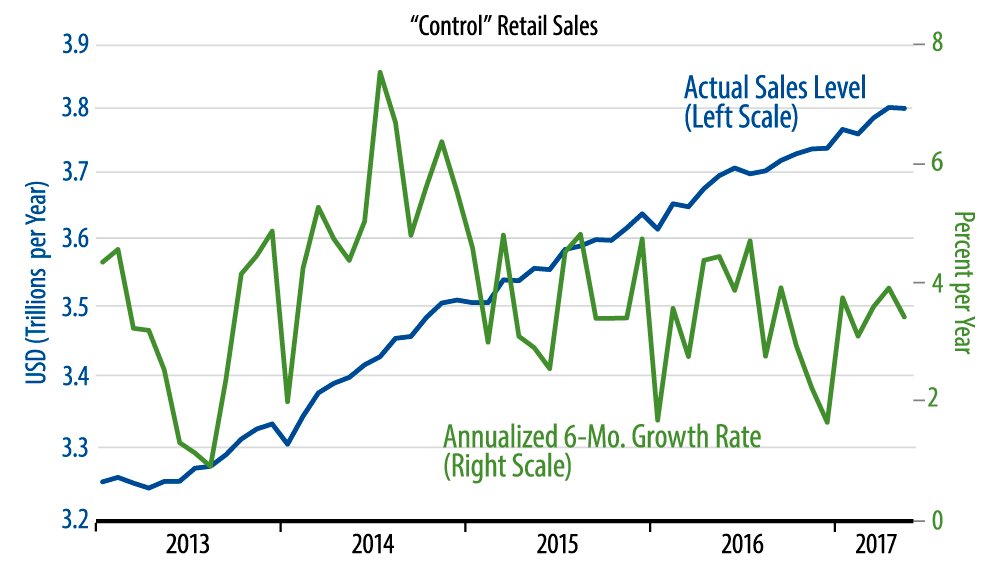
This steady, unspectacular performance can be seen in the accompanying chart. If you were to draw a trend line through the 2015 and 2016 levels of control sales (blue line), sales levels for each of the five months of 2017 so far would be right on that trend line. Thus, the 6-month growth for sale shown by the green line has hovered right around 3.5% throughout the year so far.
Again, our control measure excludes cars, gas, and building materials, while including restaurants. Sales for all of these store types are softer than what the control aggregate shows. Car sales have been steadily trending lower since December, building material sales since February. Gasoline sales have been declining since January, but that largely reflects declining prices. However, prices are not declining at restaurants, and sales there have been dropping slightly but steadily since January.
Indeed, the only major retail group showing decent growth is nonstore—mostly online—retailers. Even there, recent sales growth has been slower than what we saw this time a year ago.
Street calls for better sales growth have been based on consumer sentiment readings and stock market gains. Our calls for retail sales and consumer spending have focused on income growth. In line with slowing job growth and steady or slowing wage growth, income growth has been decelerating mildly, and that has provided a better take on actual sales trends. Once again, the income and sales data do not portray actual weakness in the economy, but they do squarely contradict the notion that growth is accelerating.