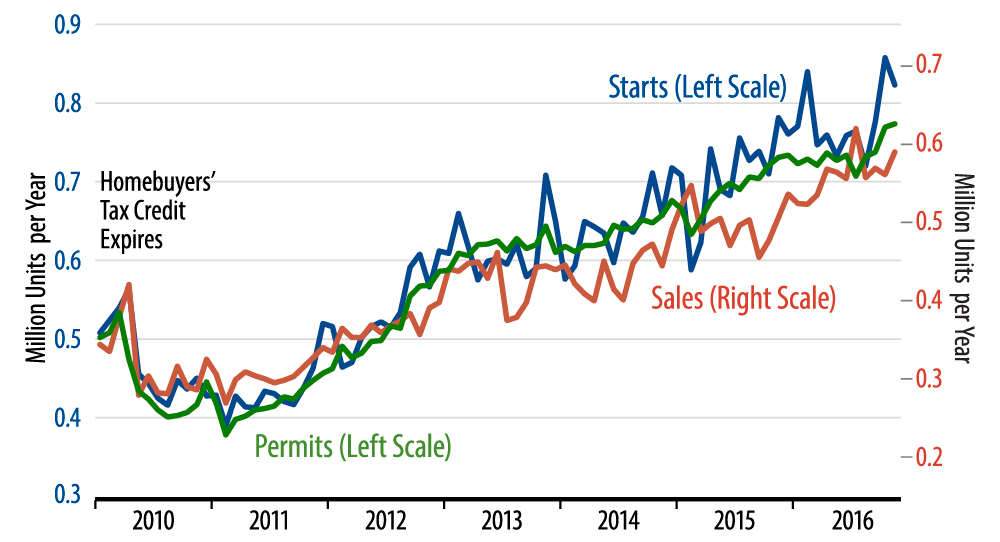
The chart’s scales have been adjusted so that the magnitude of new-home sales is comparable to that of housing starts. (They differ in magnitude because owner-builds are included in starts, but not in sales.) As you can see, the blue line has risen more sharply recently than the red line, indicating that sales have not kept up with starts, and the rise in inventories of unsold new homes buttresses this conclusion.
I don’t mean to imply that things look scary in housing. The jump in starts was explosive, possibly related to warm weather on the East Coast. So, even if we get some “seasonal” pullback in starts in the next few months, they will still likely be above the prevailing levels of earlier this year. And yes, new-home sales do look to be rising some, so there is reason to believe that homebuilding levels will trend upward over the next few months, after they had dropped off slightly through the first nine months of 2016.
A blemish within today’s new-home sales report was that sales in the South continued to decline, the fourth straight drop after an exaggerated July peak. The South accounts for more than half of all single-family homebuilding, so the sluggishness there is one more reason to think that any coming uptrend in homebuilding will be modest. Still, the November new-home sales gains in other regions were more than enough to swamp the sales decline in the South, so, again, the bulk of the homebuilding data are pointing upward at present.
This is consistent with other data seen in recent weeks. The US economy is showing better growth than the 1.3% GDP growth pace that occurred from mid-2015 through mid-2016, but we think that improvement is less dramatic than what has become baked into market pricing.
This will be our last By the Numbers installment for 2016. Merry Christmas, Happy Holidays and Happy New Year to all our readers and many thanks to you all for reading these missives.