2015年11月17日時点
Industrial production declined by 0.2% in October, though August growth was revised up by that much. This is actually a better net result than the outright declines we have been getting here for most of this year. Details within the report indicate that all of the October output decline came from the oil patch and utilities, as manufacturing production actually rose 0.4%.
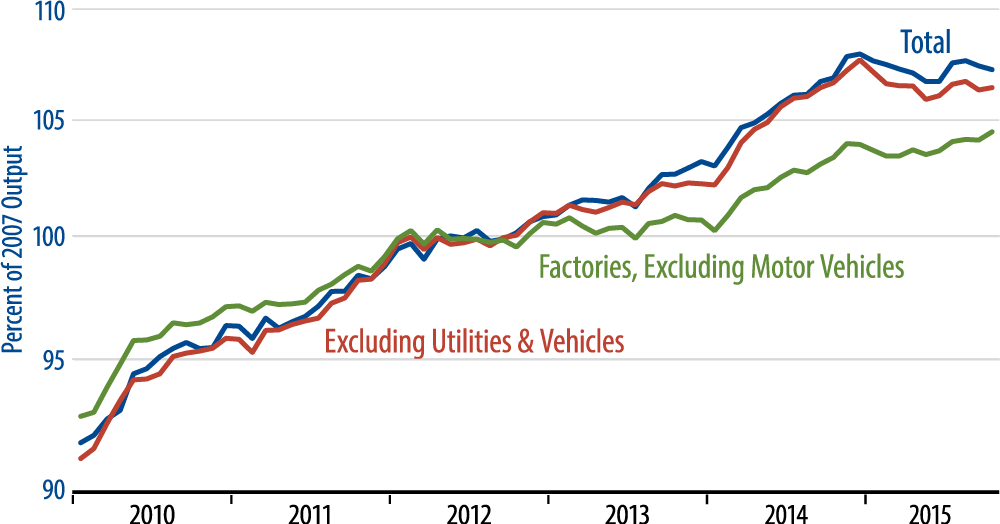
While this month’s industrial data actually weren’t so bad, it is not yet time to break out the party hats and champagne. Economic data fluctuate from month to month, and it is likely that this month’s improvements, such as they were, were a momentary fluctuation upward within a (mildly) downward trend. The accompanying chart bears out this point, although we must admit that the recent factory bounce (green line) is somewhat encouraging.
Our take is that the factory slowdown is being driven by flagging capital spending on equipment and declining exports. As you can see in the chart, factory output was soft in 2012 and 2013 before spurting in 2014, only to fall back to form this year. It is also the case that both capital spending and exports saw weak growth in 2012 and 2013, before bouncing last year. There is more to the 2015 industrial sector woes than merely a strong dollar and low oil prices, and we are inclined to think that softer industrial data will resume in coming months.
As for oil, total industrial production in September and October was indeed held down by emerging declines in US oil output. Even though oil prices have been falling since July 2014, US oil production climbed through March 2015 and then held largely stable through late-summer. However, it has finally declined since then, and this trend too is likely to continue.