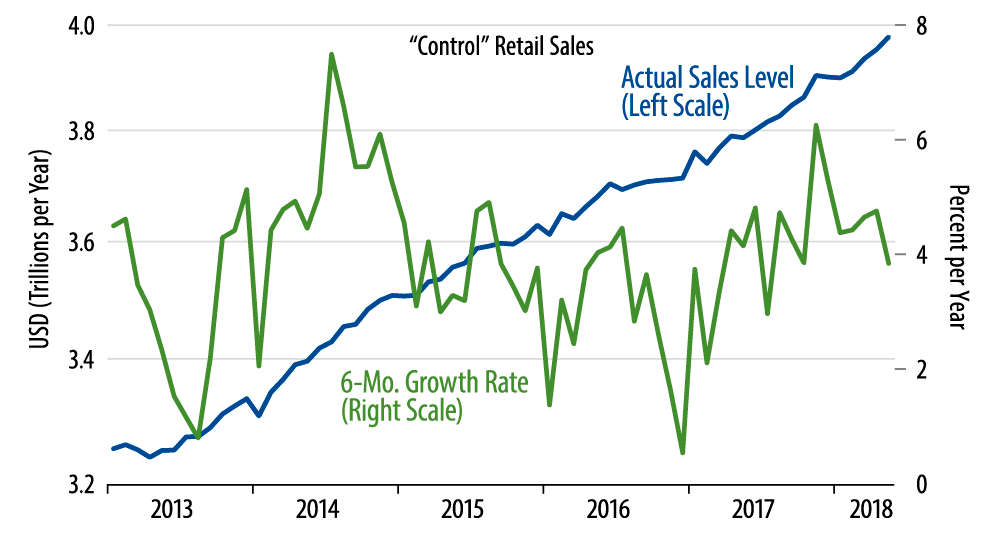
Note that the six-month growth rate shown in the chart does not—yet—reflect this acceleration. That is because the six-month calculation comes off a very strong November sales reading. 12- or three-month growth rates would show some recent pick-up in sales growth, but we stuck with the six-month growth rate shown in the chart in order to preserve continuity with our previous posts on retail sales.
Where has sales growth improved lately? In three specific areas: restaurants, apparel stores and department stores. This is an odd mix, but that is where the sales pick-up has surfaced in the data to date. Online sales get a lot of media attention, and sales there have been okay lately, but they have not shown any acceleration such as the data portray for apparel and department stores. Meanwhile, sales for purveyors of durable goods have been generally steady.
Our outlook for consumer spending, as with the economy overall, has been more downbeat than the consensus, so today’s data work against that outlook. The sales gains are somewhat narrowly focused, and available data show consumer spending on services still steady at best. Nevertheless, today’s retail sales data paint a better picture for the economy than we had been anticipating.