2014年10月24日時点
Today’s new-home sales news was very mediocre. The headline was a 0.2% gain in sales in September. The “sub-title,” but probably the main piece of news in the release, was a sharp downward revision to August data, indeed to the previous three months’ prints.
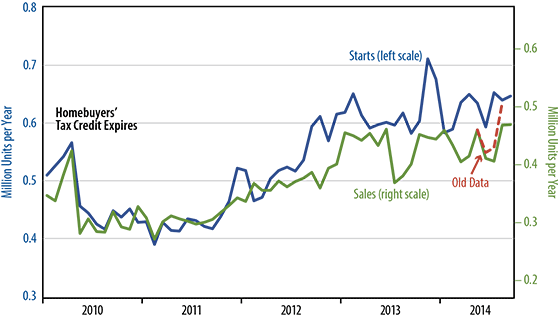
Last month, the August release for this indicator showed an 18.0% increase. Today’s news marked the August level down by -7.5%, thanks to the revisions of June through August data. (Previous data are shown by the red dotted line in the accompanying chart.)
So, where do we stand? On net, the housing picture looks identical to that of four months ago. What is left of the August gains merely offsets declines in June, and, again, the gains in September were but tiny. The best one can say is that new-home sales are dead flat, as they have been since the beginning of 2013.
The chart adjusts the scales for new-home sales and starts for coverage differences between the two. (For example, owner-builds show up in starts, but not in sales.) The relevant point from the chart is that the flat sales level of the last 21 months is not high enough to match the (also flat) rate of housing starts. A confirmation of this scaling is the fact that throughout this period, inventories of new homes have indeed been on the rise. That is, while both starts and sales have been flat, starts have proceeded faster than sales, leading to increasing stocks of unsold new homes.
The levels of new-home inventories are not alarming, but they are one more factor arguing against any upside move in homebuilding in the months to come. On all counts, then, we look for housing activity to remain flat and at relatively depressed levels for the foreseeable future.