When analyzing last month’s strong report, we cautioned that there is tremendous seasonality in the data at this time of year, and the wild swings between January and February reflect this. Our core jobs measure excludes construction and retailing precisely because of their volatility around the holidays and winter, and you can see that the core measure did not swing nearly as wildly as did the headline data.
Meanwhile, our core measure does include another sector subject to occasional seasonal swings: leisure and hospitality, that is, hotels and restaurants. This sector showed a (revised) gain of +59,000 in January, but only +4,000 in February, also likely a reflection of a spurious gain that was subsequently "averaged out."
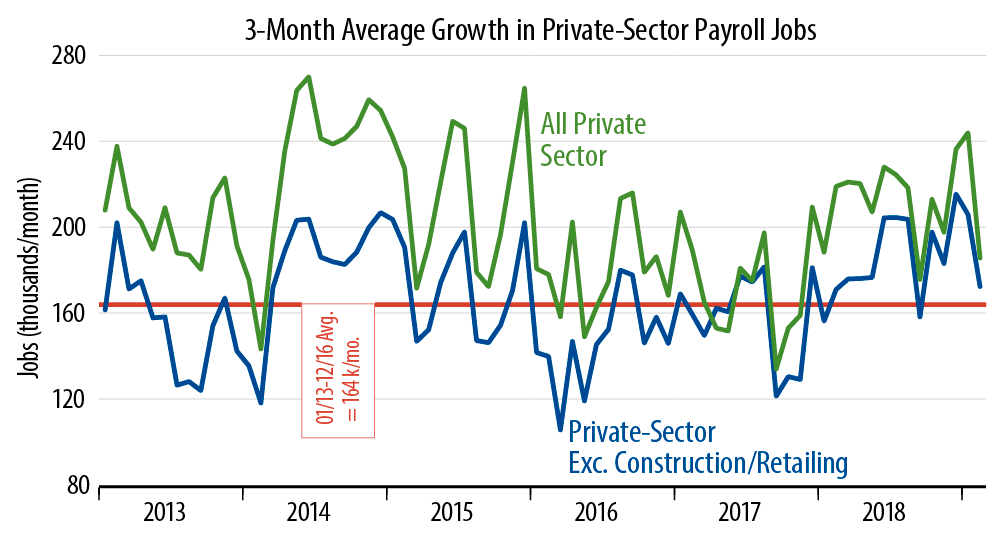
With any government data series, it is good to average the data over a few months, especially when we are at this time of the year and especially when we are seeing wild swings both to the up and down sides. The accompanying chart varies our typical job growth take by showing three-month average changes instead of one-month changes. This chart summarizes the jobs picture very succinctly and very well.
Despite the weak February print, the three-month average growth rate for jobs through February is still above the average pace of the last few years (blue line). What is more, you can clearly see a trend toward better job growth over the past year, a trend that today’s data do not threaten.
Last month, we also commented that the payroll data indicated some slowing in the pace of manufacturing growth. Those indications continued this month, with factory workweeks declining even alongside decent production job growth. All in all, the data indicate slower growth than we saw in 2018, but nothing to stoke recession fears.