
With the government shutdown a few weeks behind us, the flow of new economic data is starting to pick up, but in a more haphazard fashion than usual. Today, the Commerce Department released full data on consumer spending and personal income for 3Q25. Normally, this would happen the day after 3Q GDP data were released, but today’s release of September consumer data comes nearly three weeks before the 3Q GDP data.
Turning to today’s numbers, total real consumer spending rose very slightly, a mere 0.04% in September, and there was a downward revision to August spending levels. Both of these aspects were driven by the softer retail sales data discussed in our post last week. As we remarked then, both the downward revision to August and the soft September gain came off what had previously been a very strong August sales report, and that goes ditto for overall consumer spending.
For 3Q as a whole, consumer spending rose at a 2.7% annualized rate, up slightly from 2.5% in 2Q. These gains may not be enough to fulfill various analysts’ projections of 4% GDP growth in 3Q, but they will be enough to drive an otherwise healthy gain. To put it slightly differently, the economy is not booming the way a 4% GDP print might have suggested, but there is nothing in any of these data to even hint at recession.
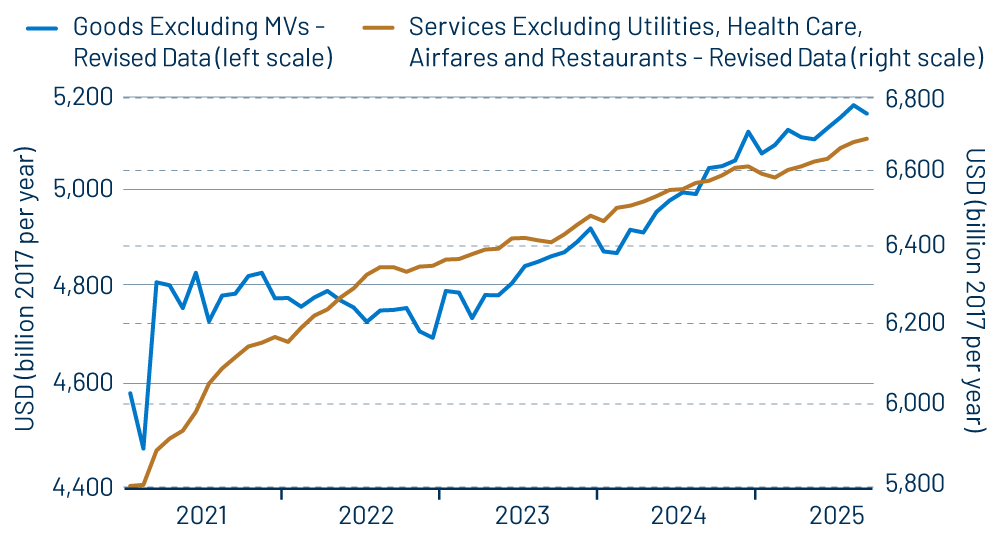
As can be seen in Exhibit 1, underlying real spending on both goods and services are growing at quite steady rates. Goods spending has slowed a little bit from last year, which rings of the effects of Mr. Trump’s tariffs. However, these effects—if indeed they are due to the tariffs—are remarkably modest. And while consumer spending growth overall is a bit slower than last year, the impact on GDP is being offset by better—or, at least, more GDP growth-friendly—movements in the trade balance. Thus, while consumer spending growth year to date is about 1 percentage point slower than a year ago, GDP growth is likely to be slightly faster.
Today’s data also featured news on September Personal Consumption Expenditure prices (PCE Price Index), which is the basis of the Federal Reserve’s official inflation targets. In September, PCE prices overall rose at a 3.3% annualized rate, while the core PCE (excluding food and energy prices) showed 2.4% annualized growth. The faster increase in the overall PCE index reflected a bounce in gasoline prices (which has since been reversed).
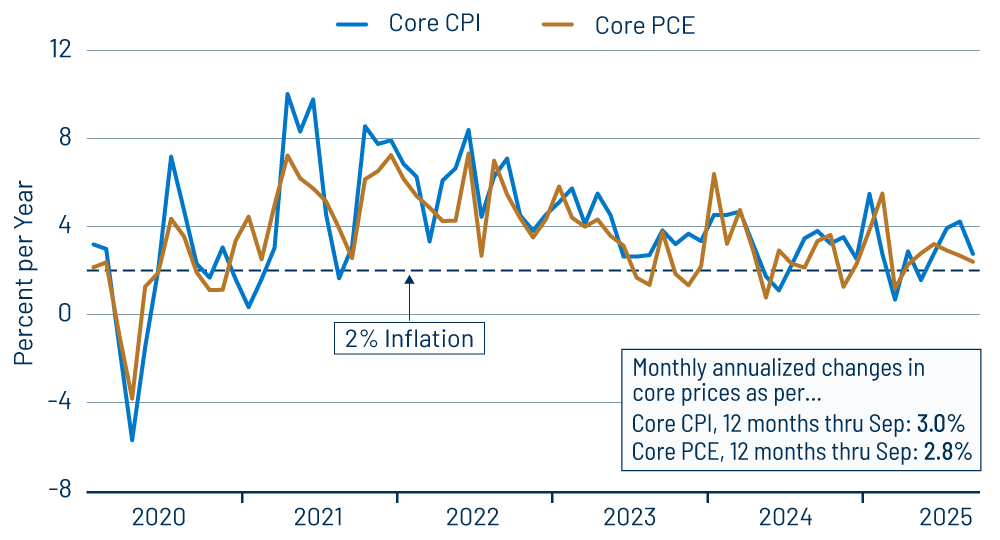
The 2.4% annualized rate of increase in the core PCE was below the September gain for the core Consumer Price Index (CPI), largely due to lower weights of vehicle prices in the PCE than in the CPI. As you can see in Exhibit 2, both the core PCE and CPI measures are showing little difference in inflation this year compared to 2024. This masks a difference, though, in composition. Service price inflation is noticeably slower this year than last, but that has been offset by positive inflation for goods prices, whereas goods prices were declining slightly in 2024. Here, too, we are inclined to attribute the 2025 swing in goods price inflation to the tariffs.
On that score, the recent data—replete with benchmark revisions released in September—are painting a more consistent picture than appeared to be the case six months ago. At that time, consumer spending on services looked to be slowing more than spending on goods, and services prices looked to be picking up compared to goods price inflation. This was the opposite of what one would expect, given that tariffs would be expected to affect goods markets directly and services markets only indirectly.
However, revisions to early-2025 data and subsequent months’ estimates have reversed these swings. Again, real goods spending has slowed a bit and goods prices have picked up, while services spending growth is the same as last year, and services prices have slowed some. This is not a huge story for the economy overall, but for an economist, it is reassuring to see the data move in accord with what economic analysis suggests. Meanwhile, again, the data suggest decent economic growth and stable—but not falling—inflation.