

Real GDP was reported to have risen at a 1.5% annualized rate in 2Q26, according to data released today by the Commerce Department (Bureau of Economic Analysis, or BEA). Meanwhile, headline inflation in the Personal Consumption Expenditures (PCE) price index was reported today by BEA to have been at an annualized rate of -1.3% in June, while core PCE inflation was 1.6%. Although these inflation rates were benign, they were noticeably higher than headline and core Consumer Price Index (CPI) rates for June, which were reported at -5.0% and -0.2%, respectively. We’ll work here through some of the anomalies in the GDP and inflation data in order to provide some insight on whence these various stats are coming.
First, at various times over the last few months, we have expressed skepticism about certain data points, thinking that the government shutdown of last fall disrupted—and so distorted—the government’s data collection and compilation practices. We’ll state up front here that we don’t think that is an issue underlying today’s GDP data. If it is an issue for the inflation numbers, that is because shutdown disruptions exacerbated differences in the CPI and PCE measures that have long been in place. On to the details.
Concerning the GDP data, the odd thing on the surface is that 2Q growth was only 1.5% despite a more robust 3.2% growth rate in domestic demand (final spending by consumers, businesses and government). That robust demand growth was bogged down by declines in the foreign trade balance and business inventories. We’ve seen some analysts point out that inventories have declined for five consecutive quarters, an unprecedentedly long string.
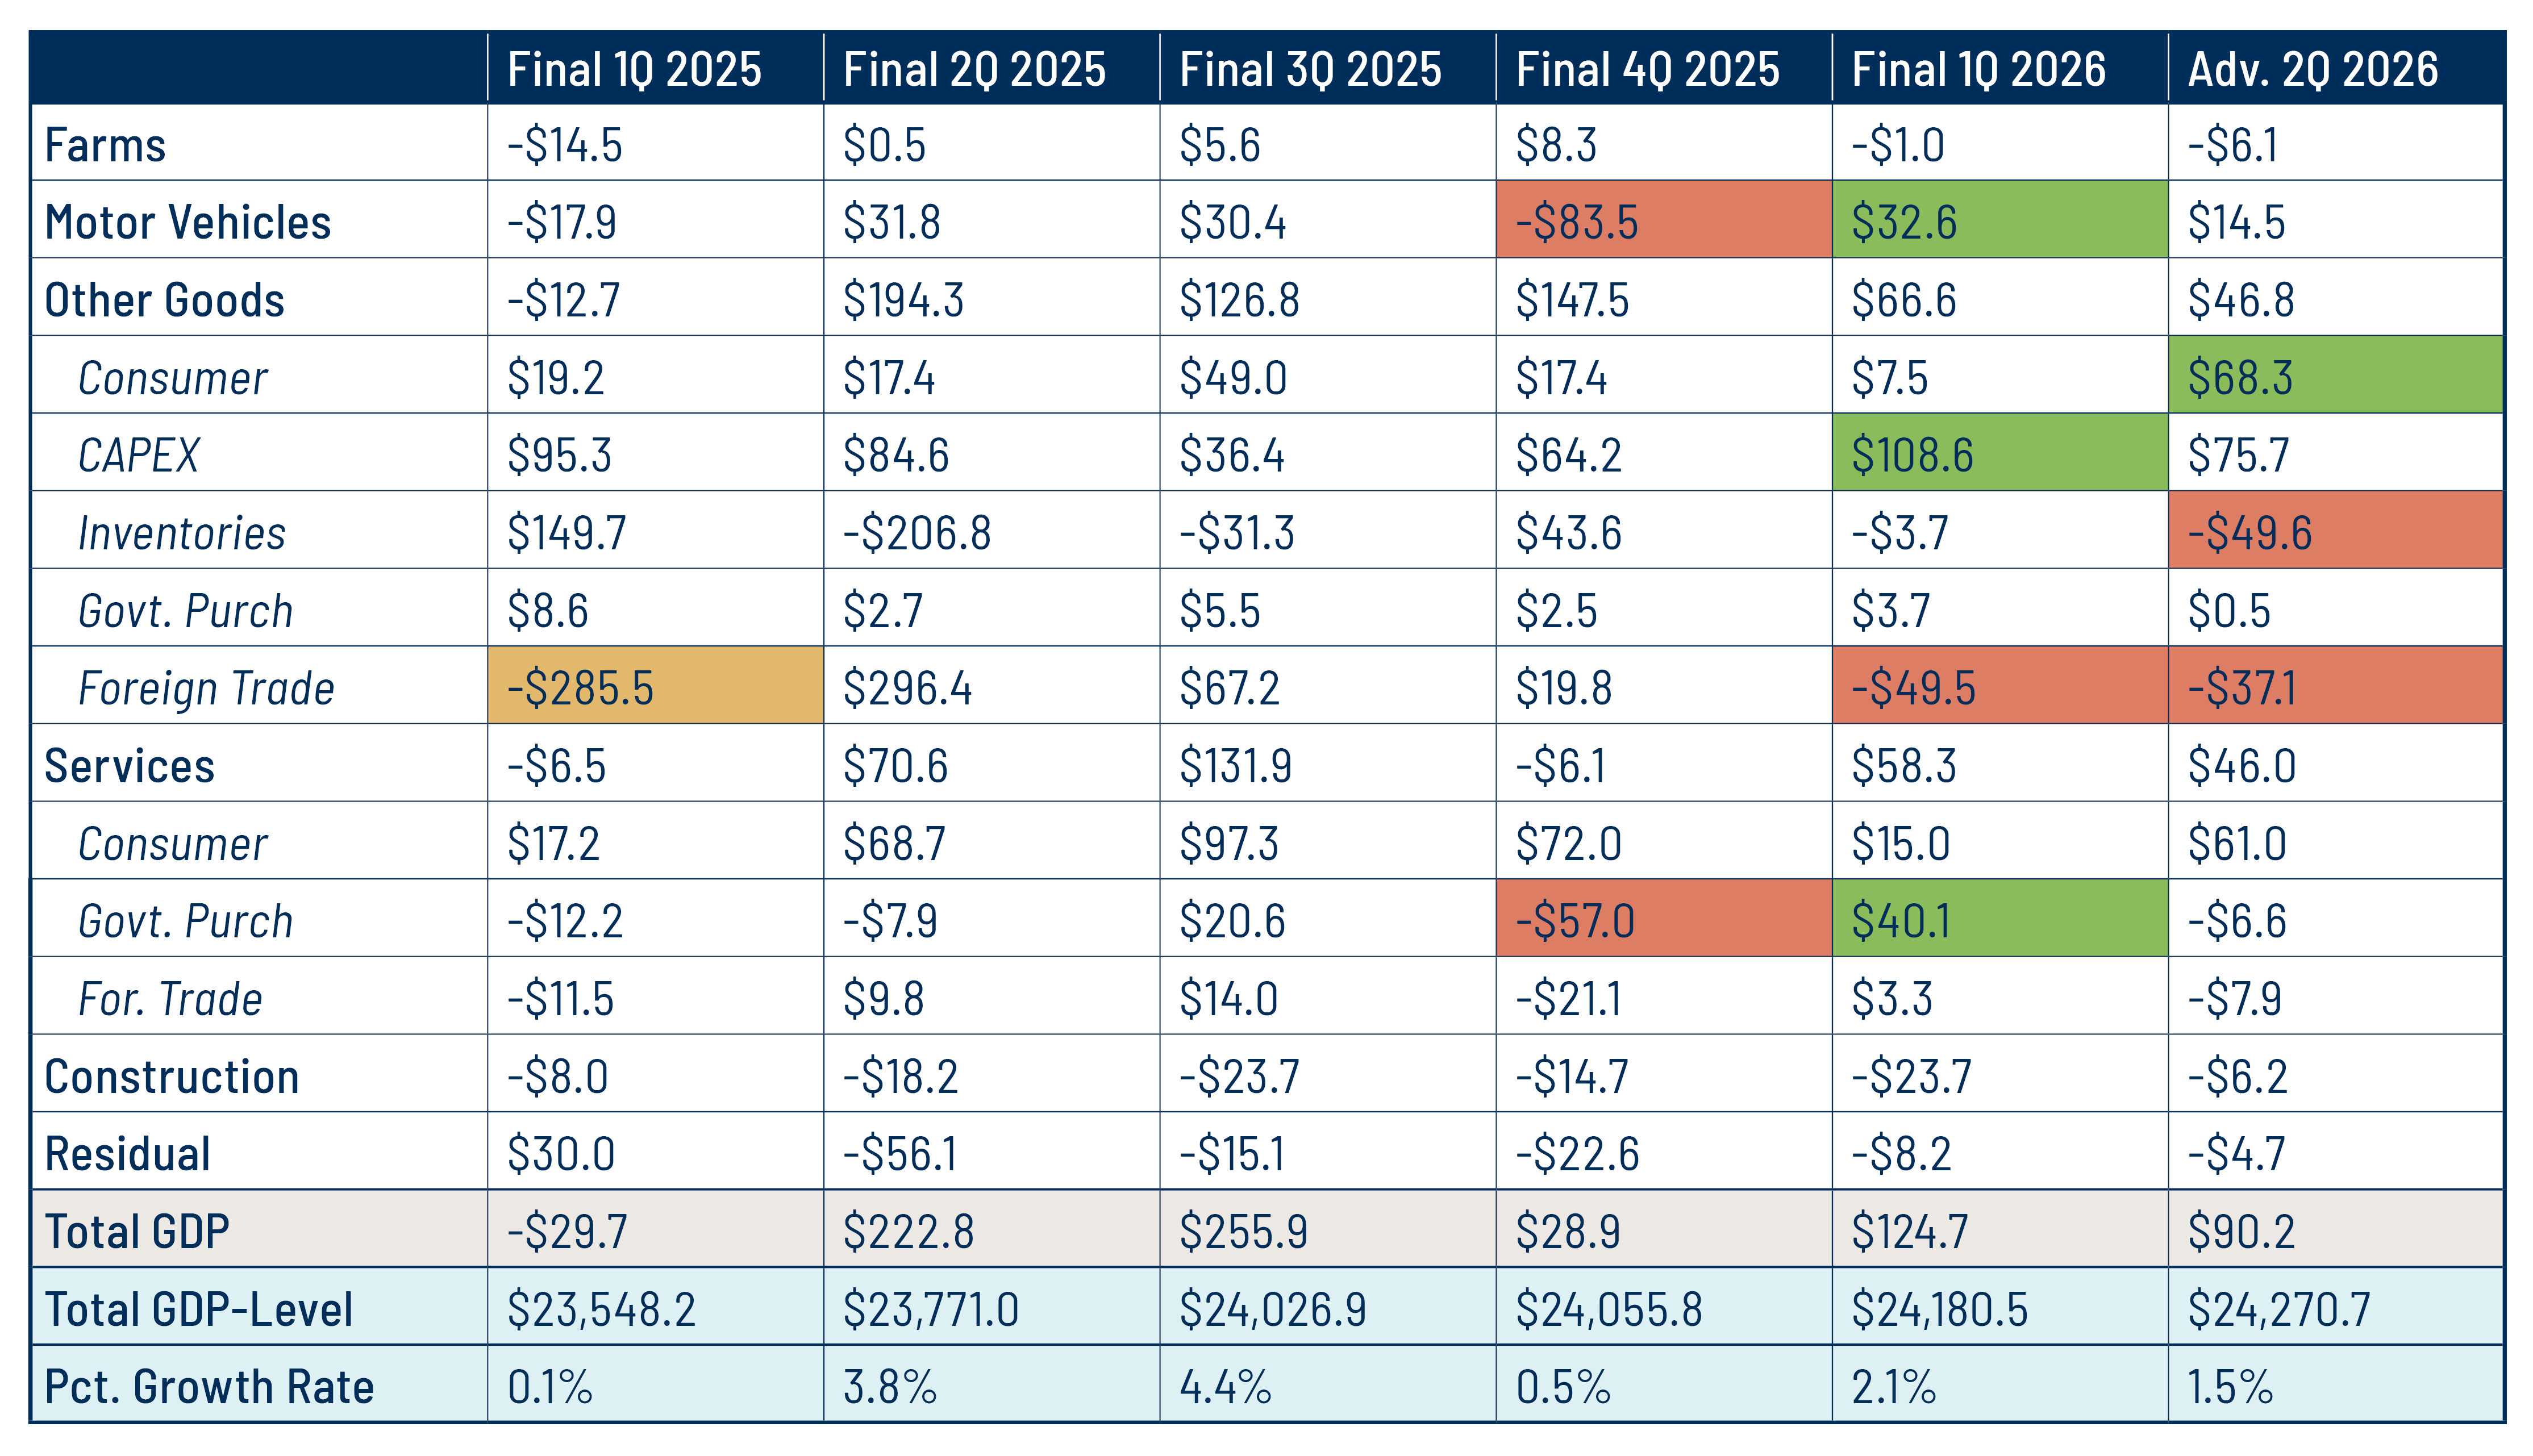
However, those ongoing inventory declines only make sense when one recalls that imports surged in the first quarter of 2026, as foreign producers and US importers ramped up shipments in order to beat expected tariffs. You can see that surge reflected in the -$285.5 billion rate of decline in the foreign trade balance in 1Q26 shown in Exhibit 1. Importers have been drawing down those stocks ever since, hence the ongoing decline in inventories.
On net, despite the drags from foreign trade and inventories, GDP of goods other than farm and motor vehicles rose by $46.8 billion in 2Q26, equivalent to annualized growth of 2.5%. This is roughly in line with the 2Q26 growth rate reported for US manufacturers in the Federal Reserve’s (Fed) industrial production (IP) report. In other words, the 2Q data for the goods sector are consistent with what other supply-side measures for the quarter are showing.
Consumer spending on goods rose nicely in 2Q, and business investment in new equipment grew very strongly. However, much of that spending went to foreign goods imported recently or in 2025 (thus coming out of inventories).
There are some oddities in the recent GDP data, namely that motor vehicle GDP has still not fully recovered its 4Q25 losses, even though the Fed’s IP data showed a full recovery in vehicle production. Similarly, the government shutdown induced a very sharp 4Q25 decline in government purchases of services, and that also has not been retraced in the last two quarters. We can’t blame the net decline in government services spending on faulty data collection. BEA should have direct knowledge of that. Rather, the net declines might reflect Trump administration staffing cuts with the new fiscal year (that began in 4Q25). As for motor vehicles, the divergence between BEA and Fed data will likely be remedied in future quarters and is not making a big difference in GDP growth in the meantime. All in all, the 2Q GDP data make sense.
As for disparities between the CPI and PCE data, these are more substantial and more questionable. The main reason economists prefer the PCE over the CPI inflation measure—and likely the reason the Fed targets PCE—is that while CPI weights for various items’ prices are fixed for five years at a time, PCE weights vary month to month as consumers shift their spending patterns in response to price variations and new products. However, there are other substantive differences that have become significant lately.
First, on top of the differences in how weights change—or don’t—over time, some weights are sharply different between the two indices. Shelter costs have a 34.0% weight in the overall CPI and a 42.8% weight in the core CPI, but only 15.4% and 17.3% weights in the headline and core PCE price indices, respectively. Similarly, motor vehicles have a much higher weight in the core CPI than in the core PCE, 34% versus 13%.
Second, within the CPI, alcoholic beverages are separate from food and beverages, so they enter the core CPI, while the PCE price index includes alcohol with food and beverages, so it is not in the core PCE. Third, the PCE index includes prices for a whole host of investment services fees. The CPI includes only fees for bank accounts and tax preparation in its “financial services” component.
We could go on, but you get the picture. The higher weights for shelter costs in the CPI have actually worked to raise CPI inflation relative to PCE inflation recently. However, alcoholic beverage prices are rising only slightly, which holds down the core CPI relative to the core PCE. Similarly, investment fees have skyrocketed, with securities commissions up at a 14.7% annualized rate year to date and investment advisory fees up at a 17.2% rate.
While these account for only 2.3% of the core PCE, their 2026 jump still single-handedly adds a bit more than 0.3% to core PCE inflation in 2026 compared to core CPI. Differences in weights for vehicles and other items induce comparable or larger disparities in the two inflation measures.
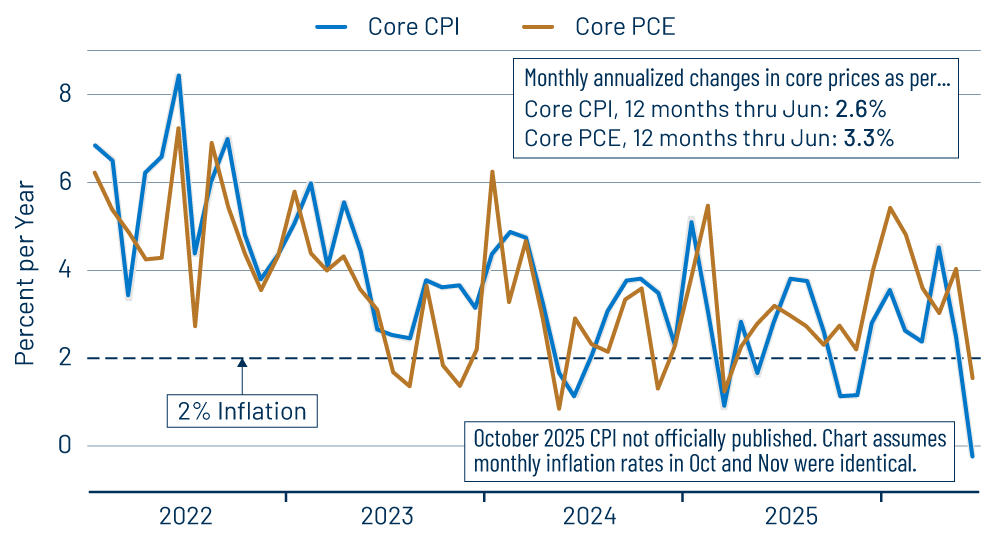
As Exhibit 2 shows, core PCE inflation has run 0.7% hotter over the last year than has core CPI, and this is the case even with the much higher weights for shelter in the core CPI. Excluding shelter, the core PCE is 1.4 percentage points higher than core CPI over the last year—3.4% versus 2.0%. We have no evidence linking these disparities to the government shutdown, but it is clear in Exhibit 2 that the bulk of the “overage” in core PCE versus core CPI has occurred in 2026, after the shutdown. Again, that overage continued in June.
The Fed has merely a preference for the PCE measure over the CPI measure, not an exclusive focus. With the differences between the two measures so substantial and so recent, with economic growth and labor market conditions modest, and with the Iran tensions affecting prices in a way that is beyond the Fed’s control and purview, we would expect the Fed to remain circumspect about above-target inflation in the core PCE measure. It certainly seemed to have behaved so at yesterday’s Federal Open Market Committee (FOMC) meeting, when it announced no change in target interest rates.