マーケット・ブログ
MARKETS
31 August 2020

Breakeven Forecasting for Prime Money Market Funds

By Jason Straker

When evaluating a money market fund, investors tend to look at characteristics that help them judge the attractiveness of a fund (e.g., cut-off time, yields and returns), including risk (e.g., weighted average maturity and life) and even the liquidity (e.g., size of the fund), but one factor often overlooked is the Net Asset Value per share, or NAV. For government and Treasury funds, and also retail prime and municipal styles of money market funds, the NAV per share remains constant at $1.00. However, there is also a “shadow” NAV that fund managers publish so that investors can track the market value of the underlying fund portfolio without impacting the value of an investor’s share position, which remains stable at $1.00.

Conversely, for Floating Net Asset Value (FNAV) institutional prime or municipal money market funds, shares are priced to four decimal places (i.e., $1.0000) and may fluctuate in small movements above and below the $1.0000 mark. For these funds, the NAV has a much more elevated role, as it can directly impact the total return of a fund investment. It should therefore be an integral component of the prime money market fund decision-making process. Although an additional step, the consideration of the NAV should not in isolation be enough to walk away from the yield advantage that institutional FNAV prime money market funds may offer. By carefully considering the simple relationship between NAV movements and yield, a suitable breakeven investment period can be calculated to help avoid breaking the key objective for all money market fund investors—the preservation of principle.

Exhibit 1: Calculation for Breakeven Investment Period
Explore Calculation for Breakeven Investment Period.
Source: Western Asset. As of 26 Aug 20. Select the image to expand the view.

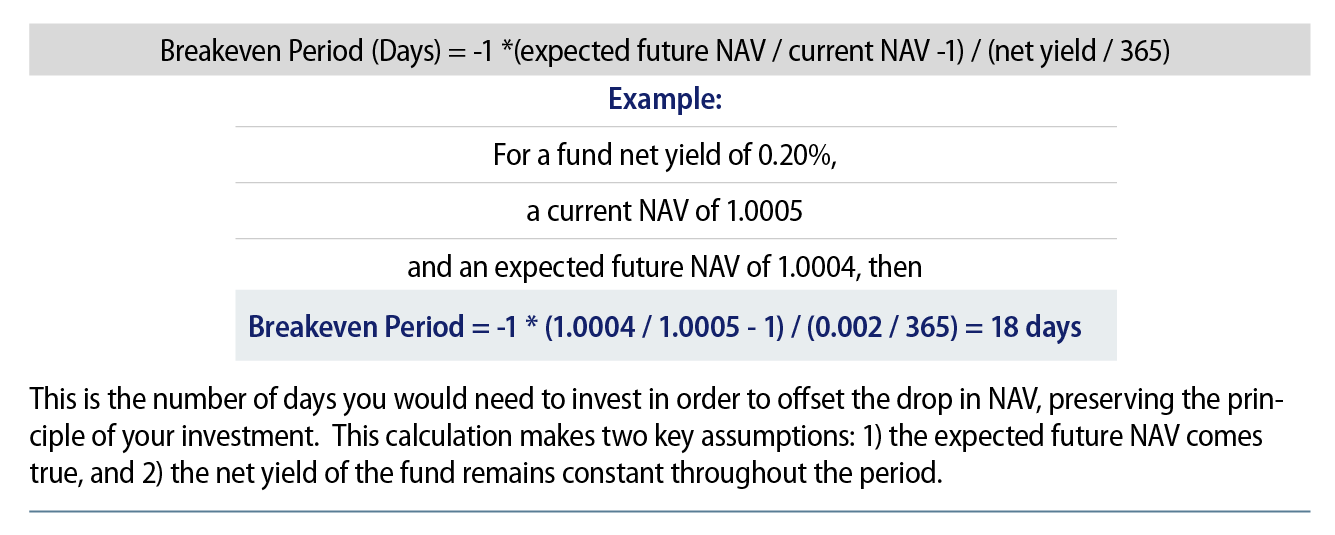
Using the calculation in Exhibit 1 you can see that the breakeven period becomes longer as yields fall, and it becomes longer as the expected future drop in NAV increases.

Exhibit 2: Relationship Between Yield, NAV Decline and Breakeven Period
Explore Relationship Between Yield, NAV Decline and Breakeven Period .
Source Western Asset. As of 26 Aug 20. Select the image to expand the view.

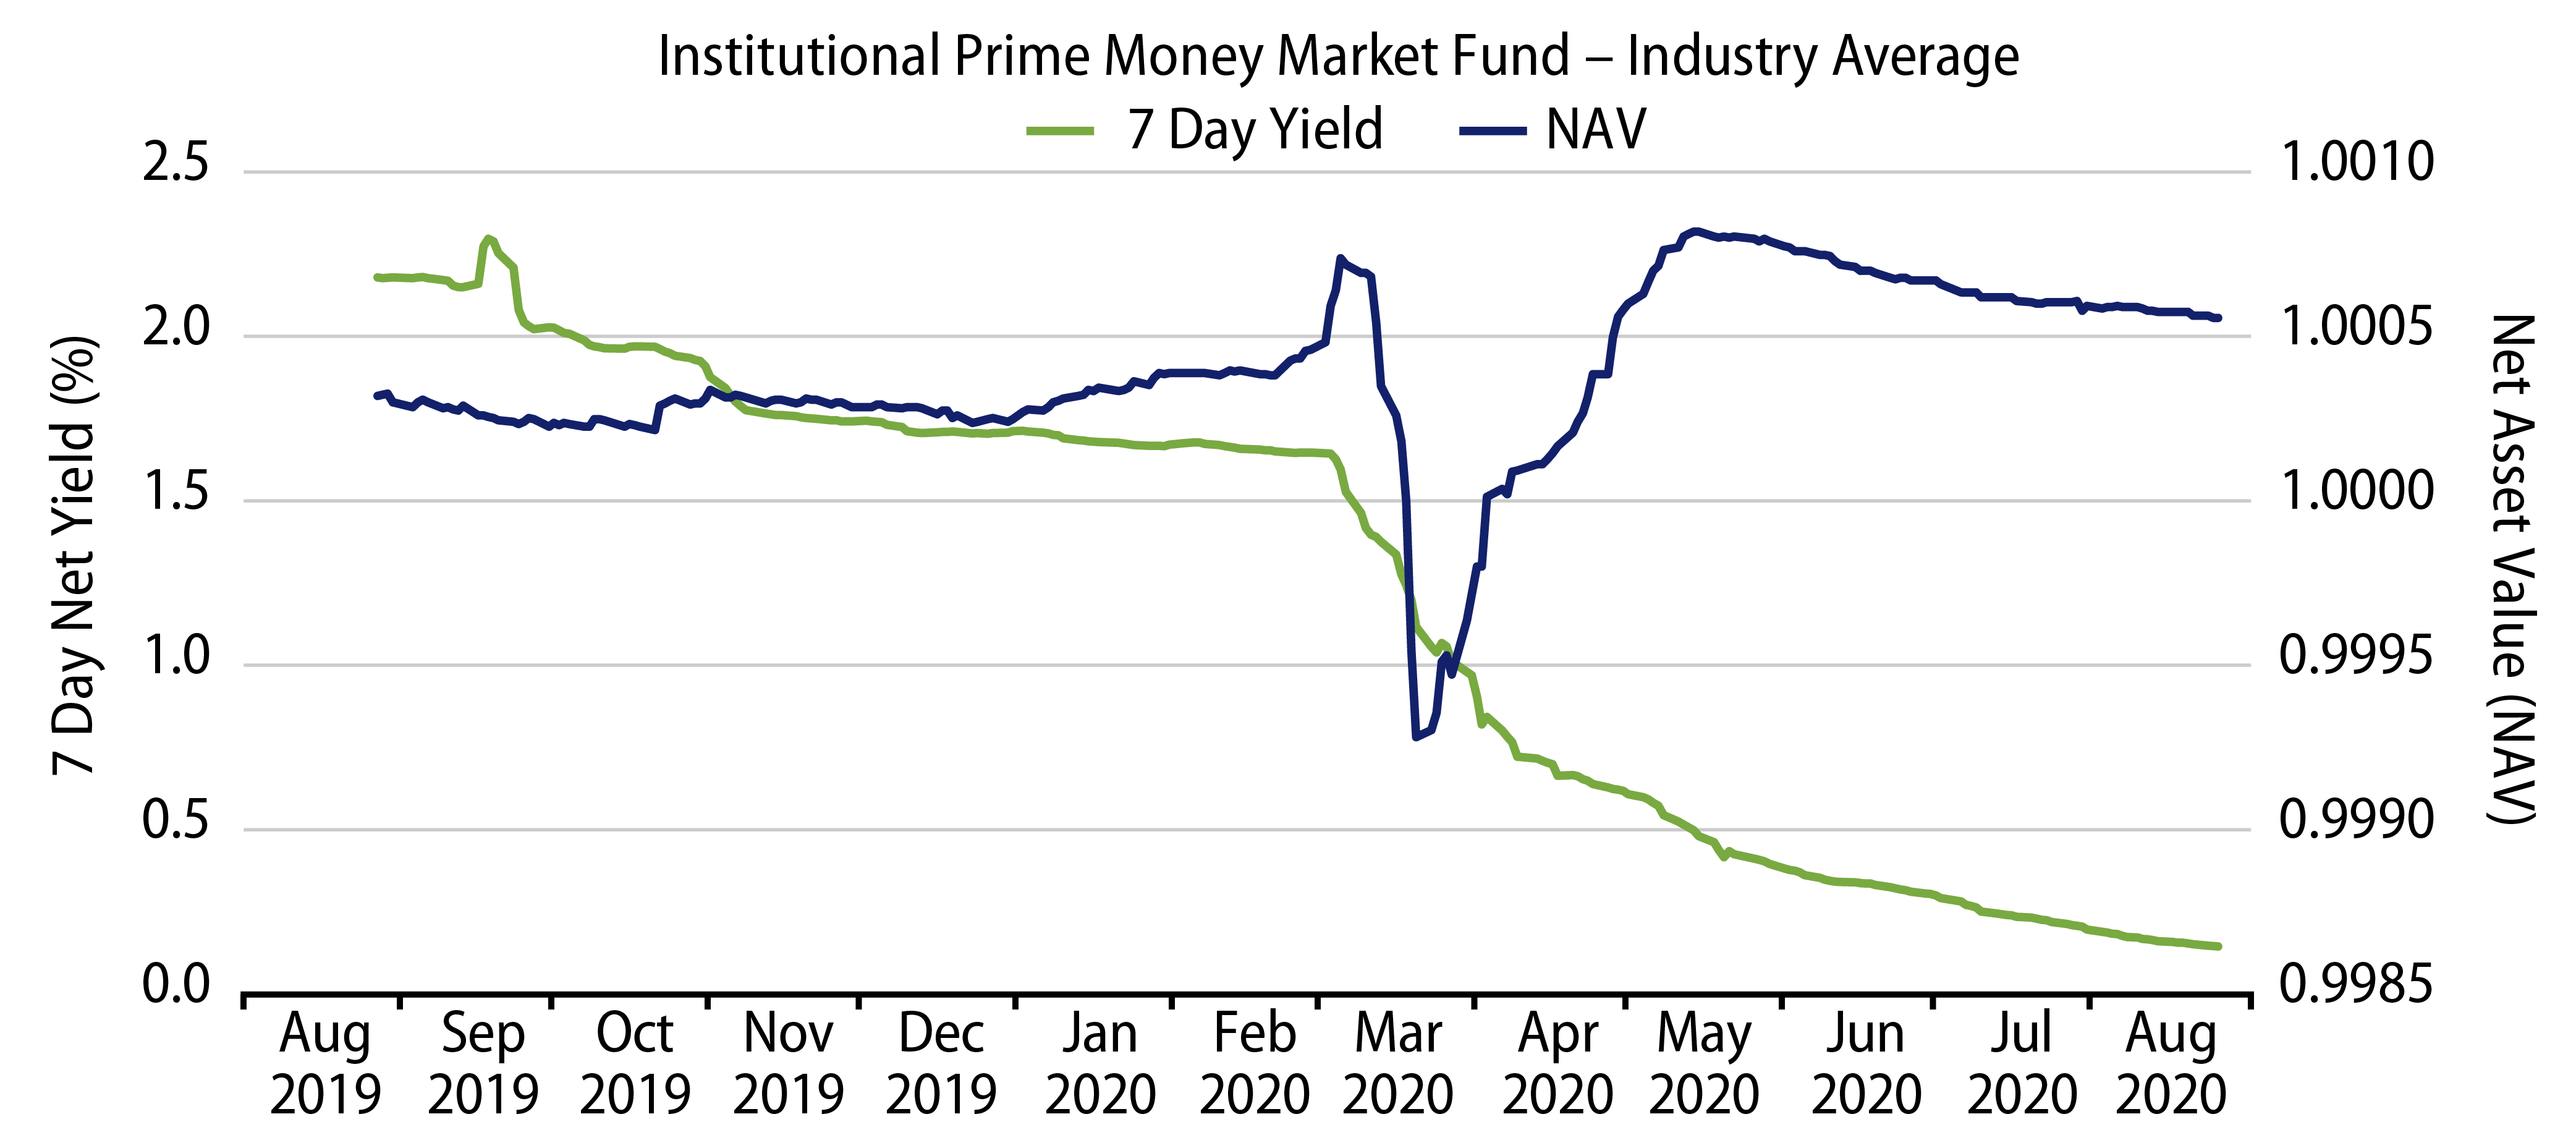
Both of the considerations of yield and NAV movements are particularly heightened in today’s market environment. First, yields have been falling considerably as the world’s central banks have cut interest rates in reaction to the economic crisis brought about by COVID-19. As yields have fallen, the amount of potential income from prime money market funds available to offset the loss from a drop in NAV has decreased.

Similarly, as the economy initially recoiled from crisis then subsequently began to heal when accommodative central bank monetary policies took effect, bond yields rose and fell while credit spreads widened then tightened, respectively, considerably increasing the volatility of the market value of securities and therefore also the NAVs of institutional prime money market funds.

Exhibit 3: Average NAV and 7-Day Yield of Institutional Prime Money Market Funds
Explore Average NAV and 7-Day Yield of Institutional Prime Money Market Funds.
Source: Crane Data. Arithmetic average taken of the Institutional share class or equivalent of Institutional Prime Money Market Funds. As of 26 Aug 20. Select the image to expand the view.

Using the information presented here, investors can apply a rational and methodical approach to evaluating the NAV of prime money market funds in order to make a suitable investment decision based on their expected investment horizon. Although the yield advantage between prime and government style money market funds has come down in recent months, the potential for greater returns still remains as long as an adequate investment period can be forecast.

Overall, we believe investors should consider institutional FNAV prime funds as a useful component of their liquidity portfolios. Investors may benefit from taking a slightly longer investment horizon than offered by Constant NAV (CNAV) government funds, given the potential for relatively higher yields combined with periodic NAV fluctuations.

投資一任契約および金融商品に係る投資顧問料(消費税を含む):
投資一任の場合は運用財産の額に対して、年率1.10%(税抜き1.00%)を上限とする運用手数料を、運用戦略ごとに定めております。 また、別途運用成果に応じてお支払いいただく手数料(成功報酬)を設定する場合があります。その料率は、運用成果の評価方法や固定報酬率の設定方法により変動しますので、手数料の金額や計算方法をこの書面に記載することはできません。
投資信託の場合は投資信託ごとに信託報酬が定められておりますので、目論見書または投資信託約款でご確認ください。

有価証券の売買又はデリバティブ取引の売買手数料を運用財産の中からお支払い頂きます。投資信託に投資する場合は信託報酬、管理報酬等の手数料が必要となります。これらの手数料には多様な料率が設定されているためこの書面に記載することはできません。デリバティブ取引を利用する場合、運用財産から委託証拠金その他の保証金を預託する場合がありますが、デリバティブ取引の額がそれらの額を上回る可能性があります。その額や計算方法はこの書面に記載することはできません。投資一任契約に基づき運用財産の運用を行った結果、金利、通貨の価格、金融商品市場における相場その他の指標に係る変動により、損失が生ずるおそれがあります。損失の額が、運用財産から預託された委託証拠金その他の保証金の額を上回る恐れがあります。個別交渉により、一部のお客様とより低い料率で投資一任契約を締結する場合があります。

©Western Asset Management Company Ltd 2024. 本資料の著作権は、ウエスタン・アセット・マネジメント株式会社およびその関連会社(以下「ウエスタン・アセット」という)に帰属するものであり、意図した受取人のみを対象として作成されたものです。本資料に記載の内容は、秘密情報及び専有情報としてお取り扱いください。ウエスタン・アセットの書面による事前の承諾なしに、全部又は一部を無断で複写、複製することや転載することを堅くお断りいたします。

過去の運用実績は将来の運用実績を示すものではありません。また、本資料は、将来の実績を予測または予想するものではありません。

本資料は、適格機関投資家、特定投資家、企業年金基金、公的年金等、豊富な投資経験と高度な専門知識とを備えたプロフェッショナルのお客様のみにご提供するものです。


本資料は情報の提供のみを目的としています。資料作成時点のウエスタン・アセットの見解を掲載したものであり、将来予告なしに変更する場合があります。また、リアルタイムの市場動向や運用に関する見解ではありません。

本資料で第三者のデータが使用されている場合、ウエスタン・アセットはそのデータが公表時点で正確であると信じていますが、それを保証するものではありません。ウエスタン・アセットの戦略・商品の受賞またはランキングが含まれている場合、これらは独立した第三者または業界出版物により公平な定量・定性情報に基づき決定されたものです。ウエスタン・アセットは、これらの第三者の標準的な業界サービスを利用したり、出版物を購読したりする場合がありますが、それらは、すべてのアセット・マネージャーが利用可能なものであり、ランキングや受賞に影響を与えるものではありません。

本資料に記載の戦略・商品には、元本の一部または全部の損失を含む大きなリスクが伴う場合があります。また、当該戦略や商品に投資することは大きな変動を伴なう可能性があり、投資家にはそのようなリスクを受け入れる経済力および意思を持つことが求められます。

特段の注記がない限り、本資料に記載の戦略のパフォーマンスはコンポジットのデータです。コンポジットではないその他のデータについては、当戦略の運用方針に最も近いと考えられる口座を、コンポジットの代表口座として掲載しています。つまり、代表口座は運用結果により選択されるものではありません。代表口座のポートフォリオ特性は、コンポジットやその他のコンポジット構成口座と異なる場合があります。これらの口座についての情報はご依頼に応じてご提供いたします。

本資料に記載している内容は、ウエスタン・アセットの投資家に対する投資助言ではありません。個別銘柄・発行体に関する一般的または具体的に言及する内容は、例としてご提示したものであり、購入または売却を推奨するものでもありません。また、ウエスタン・アセットの役職員及びお客様は、本資料に記載の有価証券を保有している可能性があります。 本資料は、会計、法務、税務、投資またはその他の助言の提供を意図したものではなく、またそれらに依存すべきではありません。お客様は、ウエスタン・アセットが提供する戦略・商品への投資を行うにあたり、経済的リスクやメリットなどについて助言が必要である場合は、ご自身の弁護士、会計士、投資家、税理士、その他のアドバイザーに相談して下さい。お客様は、居住国で適用される法令を遵守する責任を負います。

ウエスタン・アセットは世界有数の運用専門会社です。1971年の設立以来、債券運用に特化したアクティブ運用機関として最大規模の運用資産と運用チームを有しています。拠点は米国カリフォルニア州パサデナ、ニューヨーク、英国ロンドン、シンガポール、東京、豪メルボルン、ブラジル・サンパウロ、香港、スイス・チューリッヒにあり、フランクリン・リソーシズIncの完全子会社ですが、経営全般に独立性を保っており、次の6法人で構成されています。米国:ウエスタン・アセット・マネジメント・カンパニーLLC(米証券取引委員会(SEC)登録の投資顧問会社)。ブラジル・サンパウロ:ウエスタン・アセット・マネジメント・カンパニーDTVM Limitada(ブラジル証券取引委員会とブラジル中央銀行が認可・規制)。メルボルン:ウエスタン・アセット・マネジメント・カンパニーPty Ltd(事業者番号ABN 41 117 767 923、AFSライセンス303160)。シンガポール:ウエスタン・アセット・マネジメント・カンパニーPte. Ltd.(CMSライセンスCo. Reg. No. 200007692R、シンガポール通貨監督庁が監督)。日本:ウエスタン・アセット・マネジメント株式会社(金融商品取引業者、金融庁が規制)。英国:ウエスタン・アセット・マネジメント・カンパニーLimited(英金融行動監視機構(FCA)が認可(FRN145930)、規制)。本資料は英国ではFCAが定義する「プロフェッショナルな顧客」のみを対象とした宣伝目的に使用されます。許可された欧州経済領域 (EEA)加盟国へ配信する場合もあります。最新の承認済みEEA加盟国のリストは、ウエスタン・アセット(電話:+44 (0)20 7422 3000)までお問い合わせください。

詳細は当社ウエブサイトwww.westernasset.co.jpをご参照ください。
ウエスタン・アセット・マネジメント株式会社について
業務の種類: 金融商品取引業者(投資運用業、投資助言・代理業、第二種金融商品取引業)
登録番号: 関東財務局長(金商)第427号
加入協会: 一般社団法人日本投資顧問業協会(会員番号 011-01319)
一般社団法人投資信託協会