
Real consumer spending rose a scant 0.1% in April, with no revision to the March spending estimate, according to data released today by the Commerce Department (Bureau of Economic Analysis or BEA). There were a number of nuances (anomalies) in these data worth detailing.
For one thing, growth in real spending on basic services performed very differently from spending on basic merchandise, with the former up a relatively brisk +0.3%, on top of a +0.3% revision to March spending estimates, while the latter was unchanged, though its March estimate was also revised up by 0.3%. When we say “basic” services and goods spending, we mean spending after excluding the items mentioned in Exhibit 1. We exclude these items here because of their higher month-to-month volatility and also, in the case of medical care, to focus on items measuring actual out-of-pocket outlays by consumers.
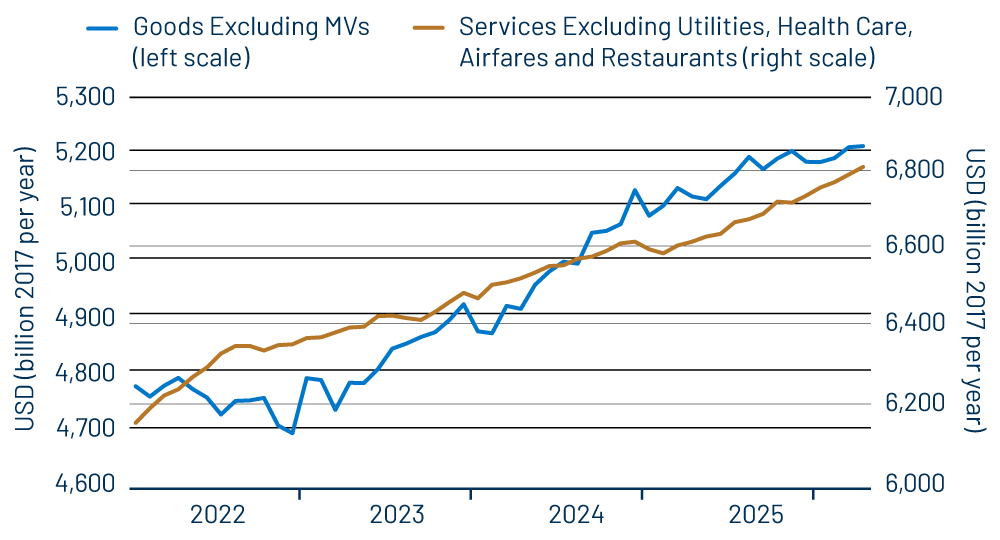
As you can see in Exhibit 1, services spending has been growing steadily, while goods spending has essentially gone flat since November. You may recall that in our May 14 post, we reported that April retail sales had risen nicely in both nominal and real terms. How could real spending on basic merchandise have been flat in April, while real retail sales of those items rose nicely?
They can’t, really. Our estimate of April real retail sales was derived using Consumer Price Index (CPI) data for April from the Labor Department (Bureau of Labor Statistics or BLS), which showed essentially no change in core goods prices in April. We thought that BEA’s Personal Consumption Expenditures (PCE) measure of core goods prices, which is the Federal Reserve’s (Fed) preferred gauge of inflation, would behave similarly. Instead, core goods within the PCE price index rose 0.3%, offsetting the gain in nominal spending. So, using a similar inflation measure for retail sales, real sales in April would have been flat as well.
Exhibit 2 illustrates how the PCE and CPI measures of core goods inflation have diverged widely over the past seven months, whereas they closely cohered in previous history. We thought coherence would reemerge in April, but that was not to be.
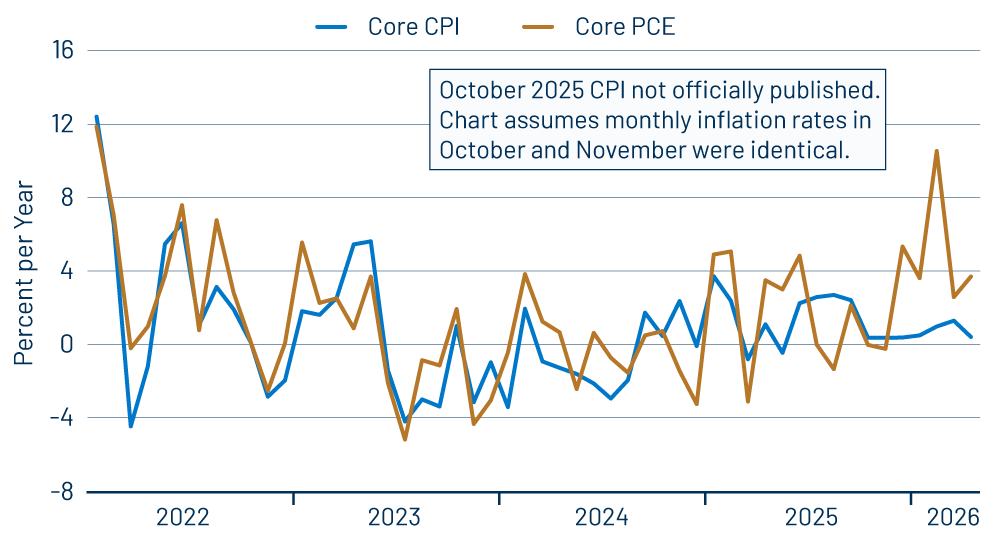
While goods price inflation has been much higher recently in the PCE inflation measure than in the CPI measure, the opposite has been the case for services prices. On net, both overall core inflation measures showed April inflation at just above 2.0%.
We all would like to know which measure is more accurate. A more basic question is why such a divergence occurred. Our guess is that the combination of budget cuts and the extended government shutdown corrupted data collection and compilation in the agencies.
Your intuition might be that the higher inflation data within the PCE index are more accurate, given what is going on in the wake of the Iran conflict. However, the divergence started four months before the emergence of Middle East hostilities. Furthermore, there is no “discord” in the data for fuel or food prices, which are up sharply in both measures.
In the meantime, it is worth pointing out that nominal consumer spending growth has been steady across recent months. If the higher PCE inflation data are correct, then real consumer spending growth has slowed in recent months in response to higher prices. However, if the lower CPI data are more accurate, then real spending growth has held up just fine, and inflation outside of energy is close to the Fed’s targets.
This is a relevant question for Fed policy, since economists generally agree that it is foolish for the Fed to try to reverse the pricing pressures coming from an external shock such as higher oil prices (or war), hence the focus on core inflation. We’ll address this issue further in a post next month covering May CPI.
Getting back to consumer spending, real spending on goods has been rising nicely in recent months for vehicles, furniture, sporting equipment and household goods, while declining for electronics, jewelry and luggage, and flattening out for clothing. Real consumer spending on services has been rising steadily for all service areas other than medical care, lodging, private education and professional services. The real spending data, as reported, are not horrible but they do show some slowing in growth recently, thanks to the aforementioned recent flattening out in basic goods spending.