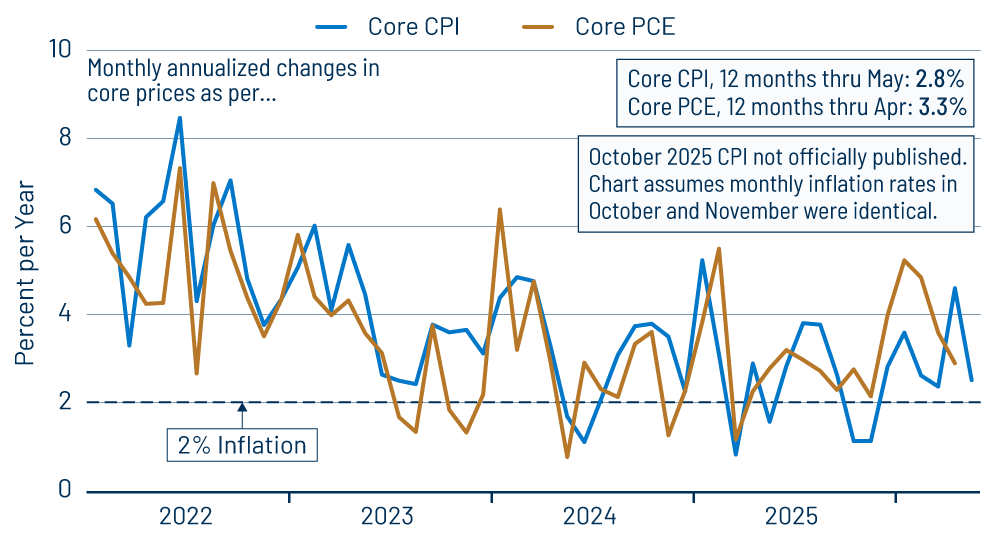
Consumer inflation per the Consumer Price Index (CPI) ran at a monthly rate of 0.5% in May, down from 0.6% in April and 0.9% in March, as energy prices continued to top off. Economists generally focus in the short term on core inflation, that is, inflation excluding food and energy prices, in order to abstract from short-term influences such as wild swings in energy prices or fluctuations in harvests. Such core inflation was better behaved, occurring at a 0.2% rate in May, the same as in March, but down from 0.4% in April, as seen in Exhibit 1.
Our take is that despite pressures from the conflict with Iran as well as Mr. Trump’s tariffs, price pressures are generally well contained and most likely to remain so. Granted, there are a number of different factors affecting prices presently, so let’s go through them in turn.
General, sustained inflation comes from central bank monetary policies, which drive the pace of nominal spending growth across the economy. Sure, oil, food and other shocks can push prices up (or down) in the near term. However, if central bank policies are not driving faster (or slower) growth in nominal spending to accommodate those pressures, higher prices will come at the expense of real output, and, eventually, the lower output will bring prices back in line (and vice versa).
Meanwhile, different analysts will look at different measures of central bank policy, but the proverbial rubber hits the road with nominal spending. If nominal spending is not accelerating or decelerating, then central bank policy is not a factor beneath the price pressures.
As you can see in Exhibit 2, nominal growth in both GDP and consumer spending has been quite stable recently, at 5% to 6% annual growth that is consistent with 2.5% to 3.5% annual inflation. It is primarily this stability that leads us to believe overall inflation pressures will remain contained.
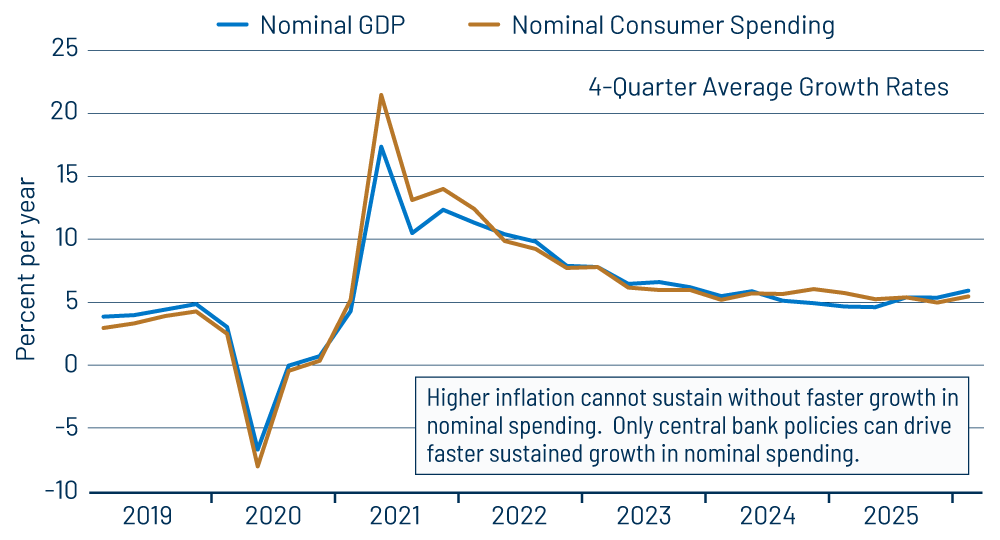
That is, the stable growth in nominal spending leads us to conclude that the recent inflation burst is transitory. Granted, the Federal Reserve (Fed) made the same “transitory” claims about inflation in 2021 and 2022. However, note from Exhibit 2 the acceleration in nominal spending that had occurred then and that belied the transitory claims then. The Fed had to tighten policy substantially at that time to slow down nominal spending growth in order to make its “transitory” claims ring true. No such tightening is necessary now. Nominal spending growth is already contained.
Here is where the “other factors” come in. While overall inflation pressures are modest, there have been short-term headwinds from the Mideast conflict and from tariffs. Thanks to the conflict, energy prices rose 6.4% in February and 10.9% in March. In April and May, the energy price increases were smaller, but still rose sharply, by 3.8% and 3.9%, respectively. This 20.3% cumulative increase has inflicted considerable pain at the pump for consumers.
However, it has not generated pass-through price increases for other prices. Core goods CPI prices have risen only modestly over the past four months, and they even declined -0.1% in May. In a “normal” 2% inflation environment, core goods prices will typically decline at such a monthly rate. Thanks to tariffs, we saw rising prices for core goods last year, 0.2% to 0.3% per month over June through September 2025. However, those increases faded away in late 2025, and they have mostly stayed low during the Iran troubles, showing changes of 0.0%, 0.1%, 0.1%, 0.0% and -0.1% over the five months to date of 2026, respectively.
As for services prices, the only services sector showing faster inflation recently has been housing costs, with owner and renter rents rising about 0.25%, 0.53% and 0.33% in March, April and May, respectively, after these rents had been rising at monthly rates below 0.2% over the previous year. It’s hard to see why Mideast conflict would be pushing up housing rents when other services prices have been largely unaffected. Meanwhile, home sale prices have remained flat to falling in recent months. Whether or not these reported rent increases are for real, they don’t appear to be evidence of general inflation pressures, given the lack of pass-through from oil on other prices.
One other puzzling piece of the inflation picture is the disparate behavior of core goods prices in the CPI and Personal Consumption Expenditures (PCE) inflation measures. We mentioned earlier that the slight monthly increases in core goods CPI prices amounted to a 0.7% annualized rate of increase over the five months of December through April. Over that same period, the core goods PCE showed a 5.1% annualized rate of increase, which was sharply higher. This gap accounts for most of the disparity between overall core CPI and PCE inflation seen since November 2025.
In our previous post on April 13, we showed a number of areas where PCE increases differed markedly from those for the CPI, such as high-tech items, sporting goods and periodicals. Closer inspection reveals that our findings were off the mark a bit. Yes, high-tech item prices have risen much faster within the PCE than in the CPI recently, but that was because smartphones—whose prices are still declining rapidly—are in telephone equipment within the PCE, but are considered high-tech items within the CPI. Similarly, periodicals within the PCE do not include recreational books, whereas periodicals within the CPI do. The “raw” prices for these and other items are rising similarly in both the CPI and PCE, but the sector groupings, again, are different.
So, why are the core goods CPI and PCE measures rising so differently? Mainly because of very different weighting schemes across the two indices. For example, vehicles comprise just over 13% of core goods PCE, but nearly 34% of core goods CPI. Computers, software and actual periodicals hold much higher weights in core goods PCE than in the CPI: 2.4% versus 1.6%, 5.2% versus 0.2% and 2.1% versus 0.3%. Vehicle prices have been falling recently, while computer, software and periodical prices have been rising. We are flummoxed, as you might be, by these technicalities, but the large disparate swings in relative prices for such items combine with their very different weights to provide noticeably different takes on recent inflation rates.
Fuel costs are still high, but they appear to have peaked, so that energy costs will likely not further propel inflation in months to come. And, again, overall, “general” inflation pressures look to be contained, despite the spike in fuel costs. So, we would expect much better inflation data in the next few months. Meanwhile, with all the pricing vagaries going on, you do need to look “under the hood” to get a good idea of what is going on with inflation.