Headline Consumer Price Index (CPI) inflation came in at -0.1% in December, for an annualized rate of -0.9%. Core CPI inflation for December was 0.3%, for an annualized rate of 3.7%. The bulk of core inflation came from shelter, with both renters’ and homeowners’ costs rising at slightly less than a 10% annualized rate.
Federal Reserve (Fed) Chair Powell himself has acknowledged that for technical reasons, the shelter components of the CPI lag reality. Facts “on the ground,” that is, in the real estate market, point to declining rents and declining home prices currently, realities that won’t be reflected in the CPI for a few months yet.
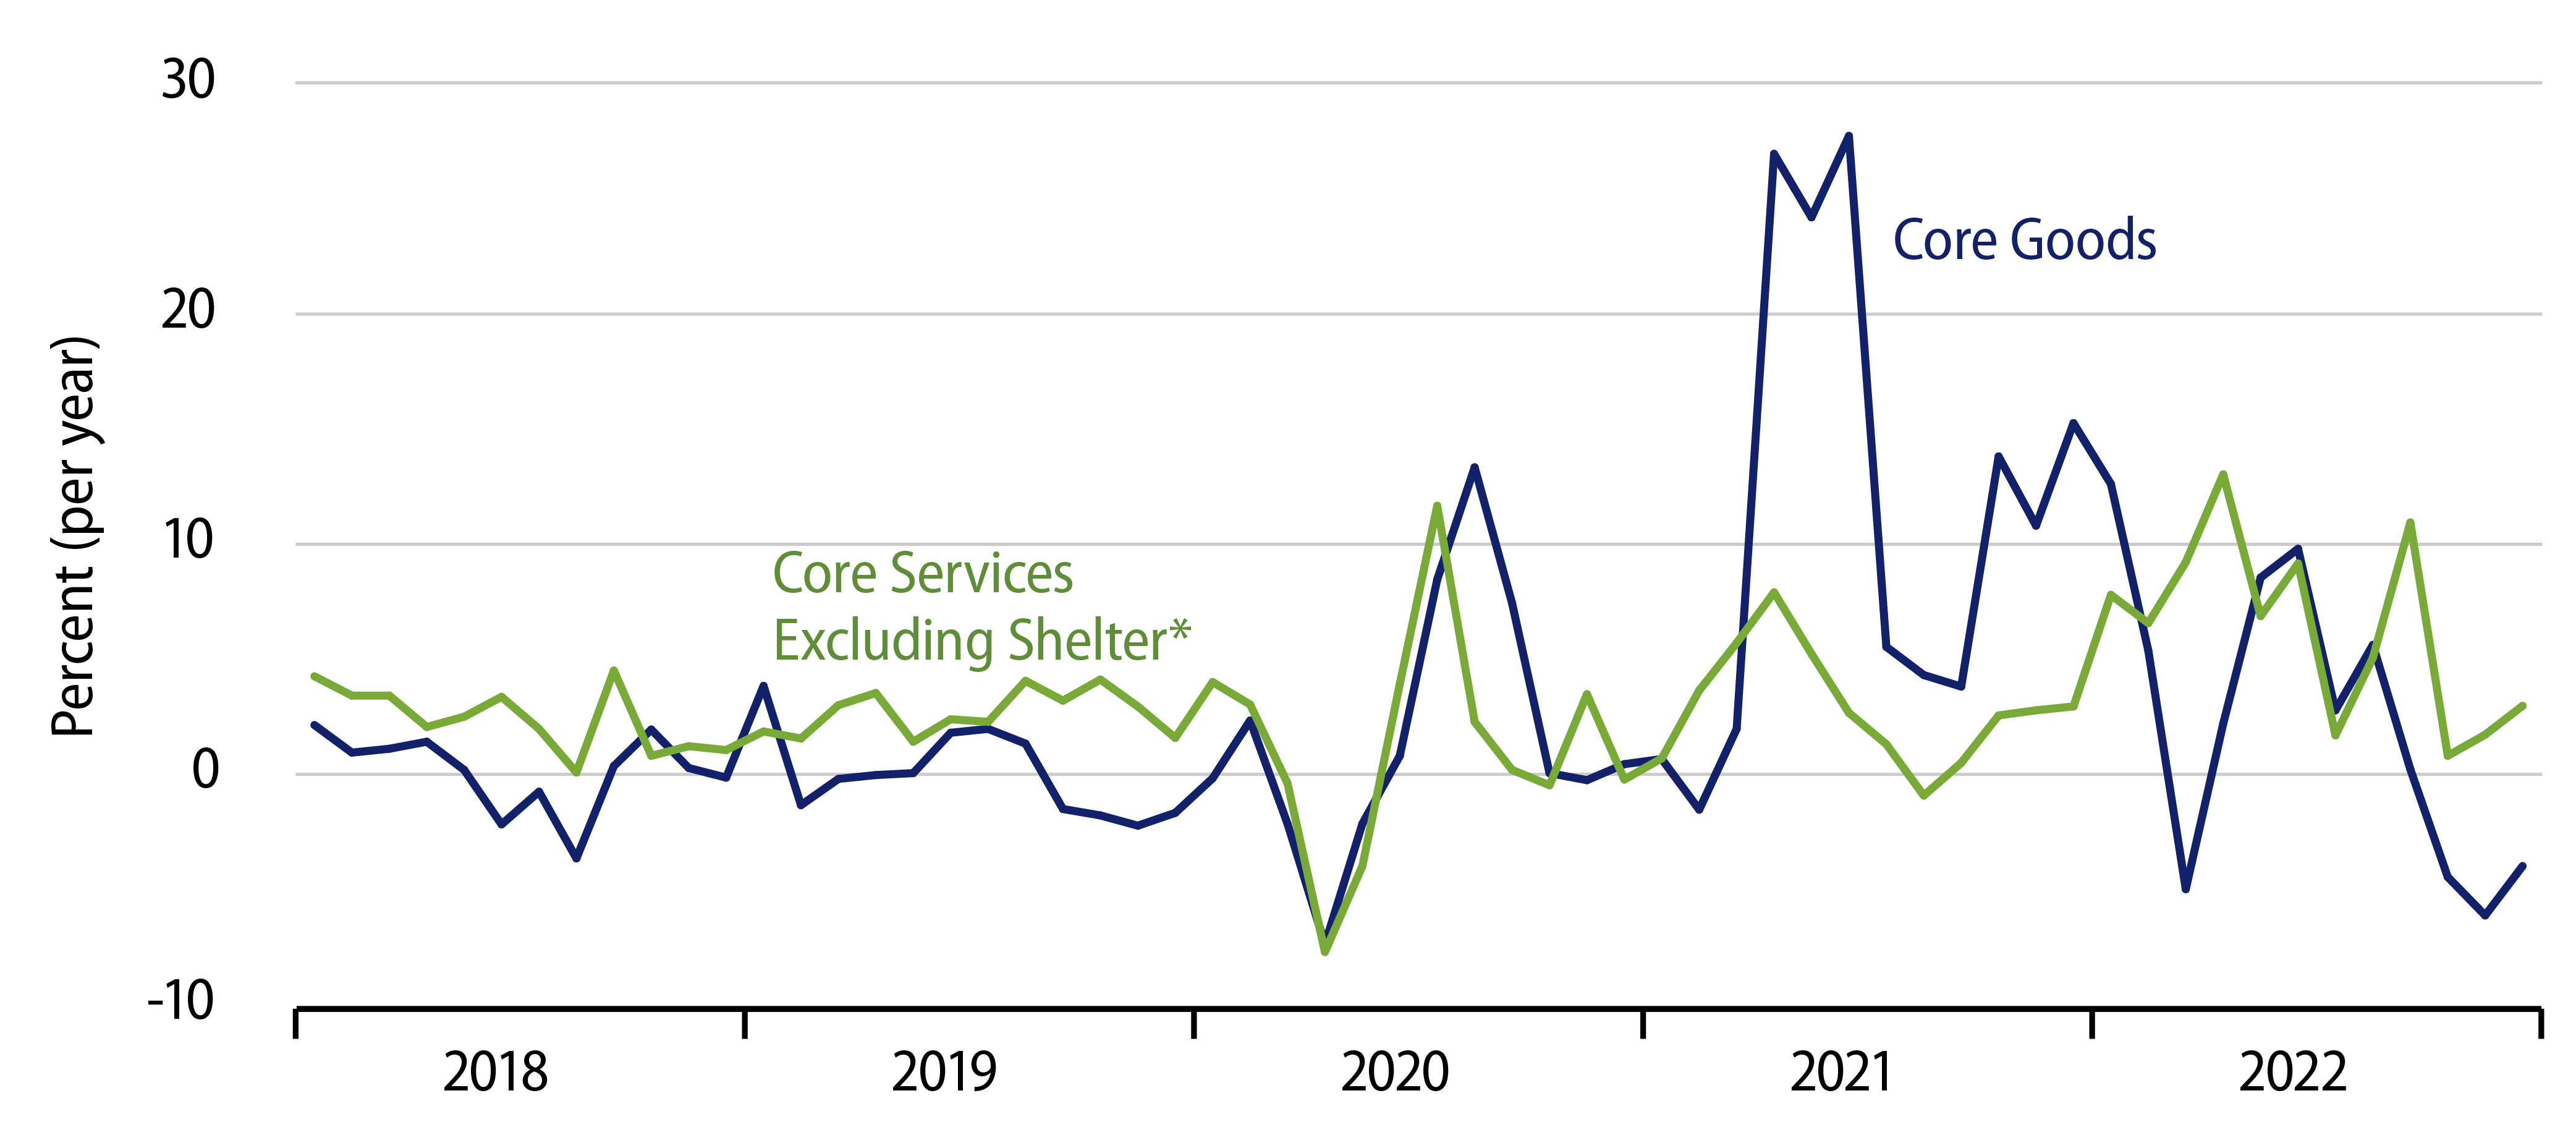
And aside from shelter costs, core inflation came in much lower. In fact, as you can see in the accompanying chart, both core goods and core services-ex-shelter inflation have held at or below pre-Covid rates for the past three months. Goods prices have been falling for the past four months and falling at rates faster than were seen prior to the Covid shutdown. Services prices excluding shelter have been bouncing around, as they always do, but price increases in each of the last three months have been within the range of variation seen prior to 2020.
Now, we typically state that one month doesn’t make a trend. However, three months do start to. With three months of acceptable—or lower than acceptable—inflation in the core components that don’t have obvious technical lags, one would think that Mr. Powell and company would start to take notice. As stated in our January 6 post, there are ample signs of the economy slowing. Now, there are considerable signs that inflation is in the Fed’s desired range, not some months from now, but right now.
Let’s take on the possible pushbacks to this claim. First, yes, shelter prices in the CPI are rising faster than is acceptable. However, again, Mr. Powell himself has acknowledged that those reported data are at odds with current real estate market realities.
Second, core inflation excludes food and energy. Well, energy prices have been dropping for the last six months. As for food prices, they too have seen steadily slower rates of increase. As of July, food prices were rising at a 13.5% annualized rate. That rate then declined steadily in subsequent months, with the rate for December just 3.5%. There is every reason to expect that declining trend to continue.
Third, our focus on monthly inflation ignores the fact that core inflation over the past 12 months has been 5.7% on an annualized basis, with headline inflation at 6.4%. However, any economist—at least, any trained economist—knows that looking at a 12-month growth rate imparts a six-month lag into one’s statistics. In other words, the December-over-December inflation measure describes inflation six months ago, not presently.
The only reason to focus on 12-month growth rates is when seasonal patterns in a series are unreliable. The one-month annualized inflation rates (in seasonally adjusted data) in the accompanying chart do exhibit some month-to-month variation, but nothing amounting to clear seasonal “noise.” We don’t focus on year-over-year data for jobs, GDP, retail sales or any of the indicators covered in these posts. Why should inflation be any different.?
It shouldn’t. And, again, focusing on trends becoming clear in the data for three months now, the battle against inflation has already been won. Hopefully, somebody will notice.