
“Trying to predict the future is like trying to drive down a country road at night with no lights while looking out the back window.”
~Peter Drucker
While at times it certainly feels like Peter Drucker was right in his description of trying to predict the future, investors can’t help but work toward proving him wrong. In fact, those of us investing in the fixed-income market are day-in and day-out looking for ways to shine bright lights upon those dark country roads. It’s true that predicting exactly what will happen in the future is impossible; what is not impossible is analyzing past and present fundamental performance to glean insight into what might happen in the future. This humble yet long-tested approach is what those of us analyzing and investing in the residential mortgage-backed securities (RMBS) sector employ in seeking to navigate the dark night, as it were. Based on historical performance of the US housing market, Western Asset’s proprietary Housing Market Monitor gauges the current condition of US housing and, subsequently, what home prices could do in the future.
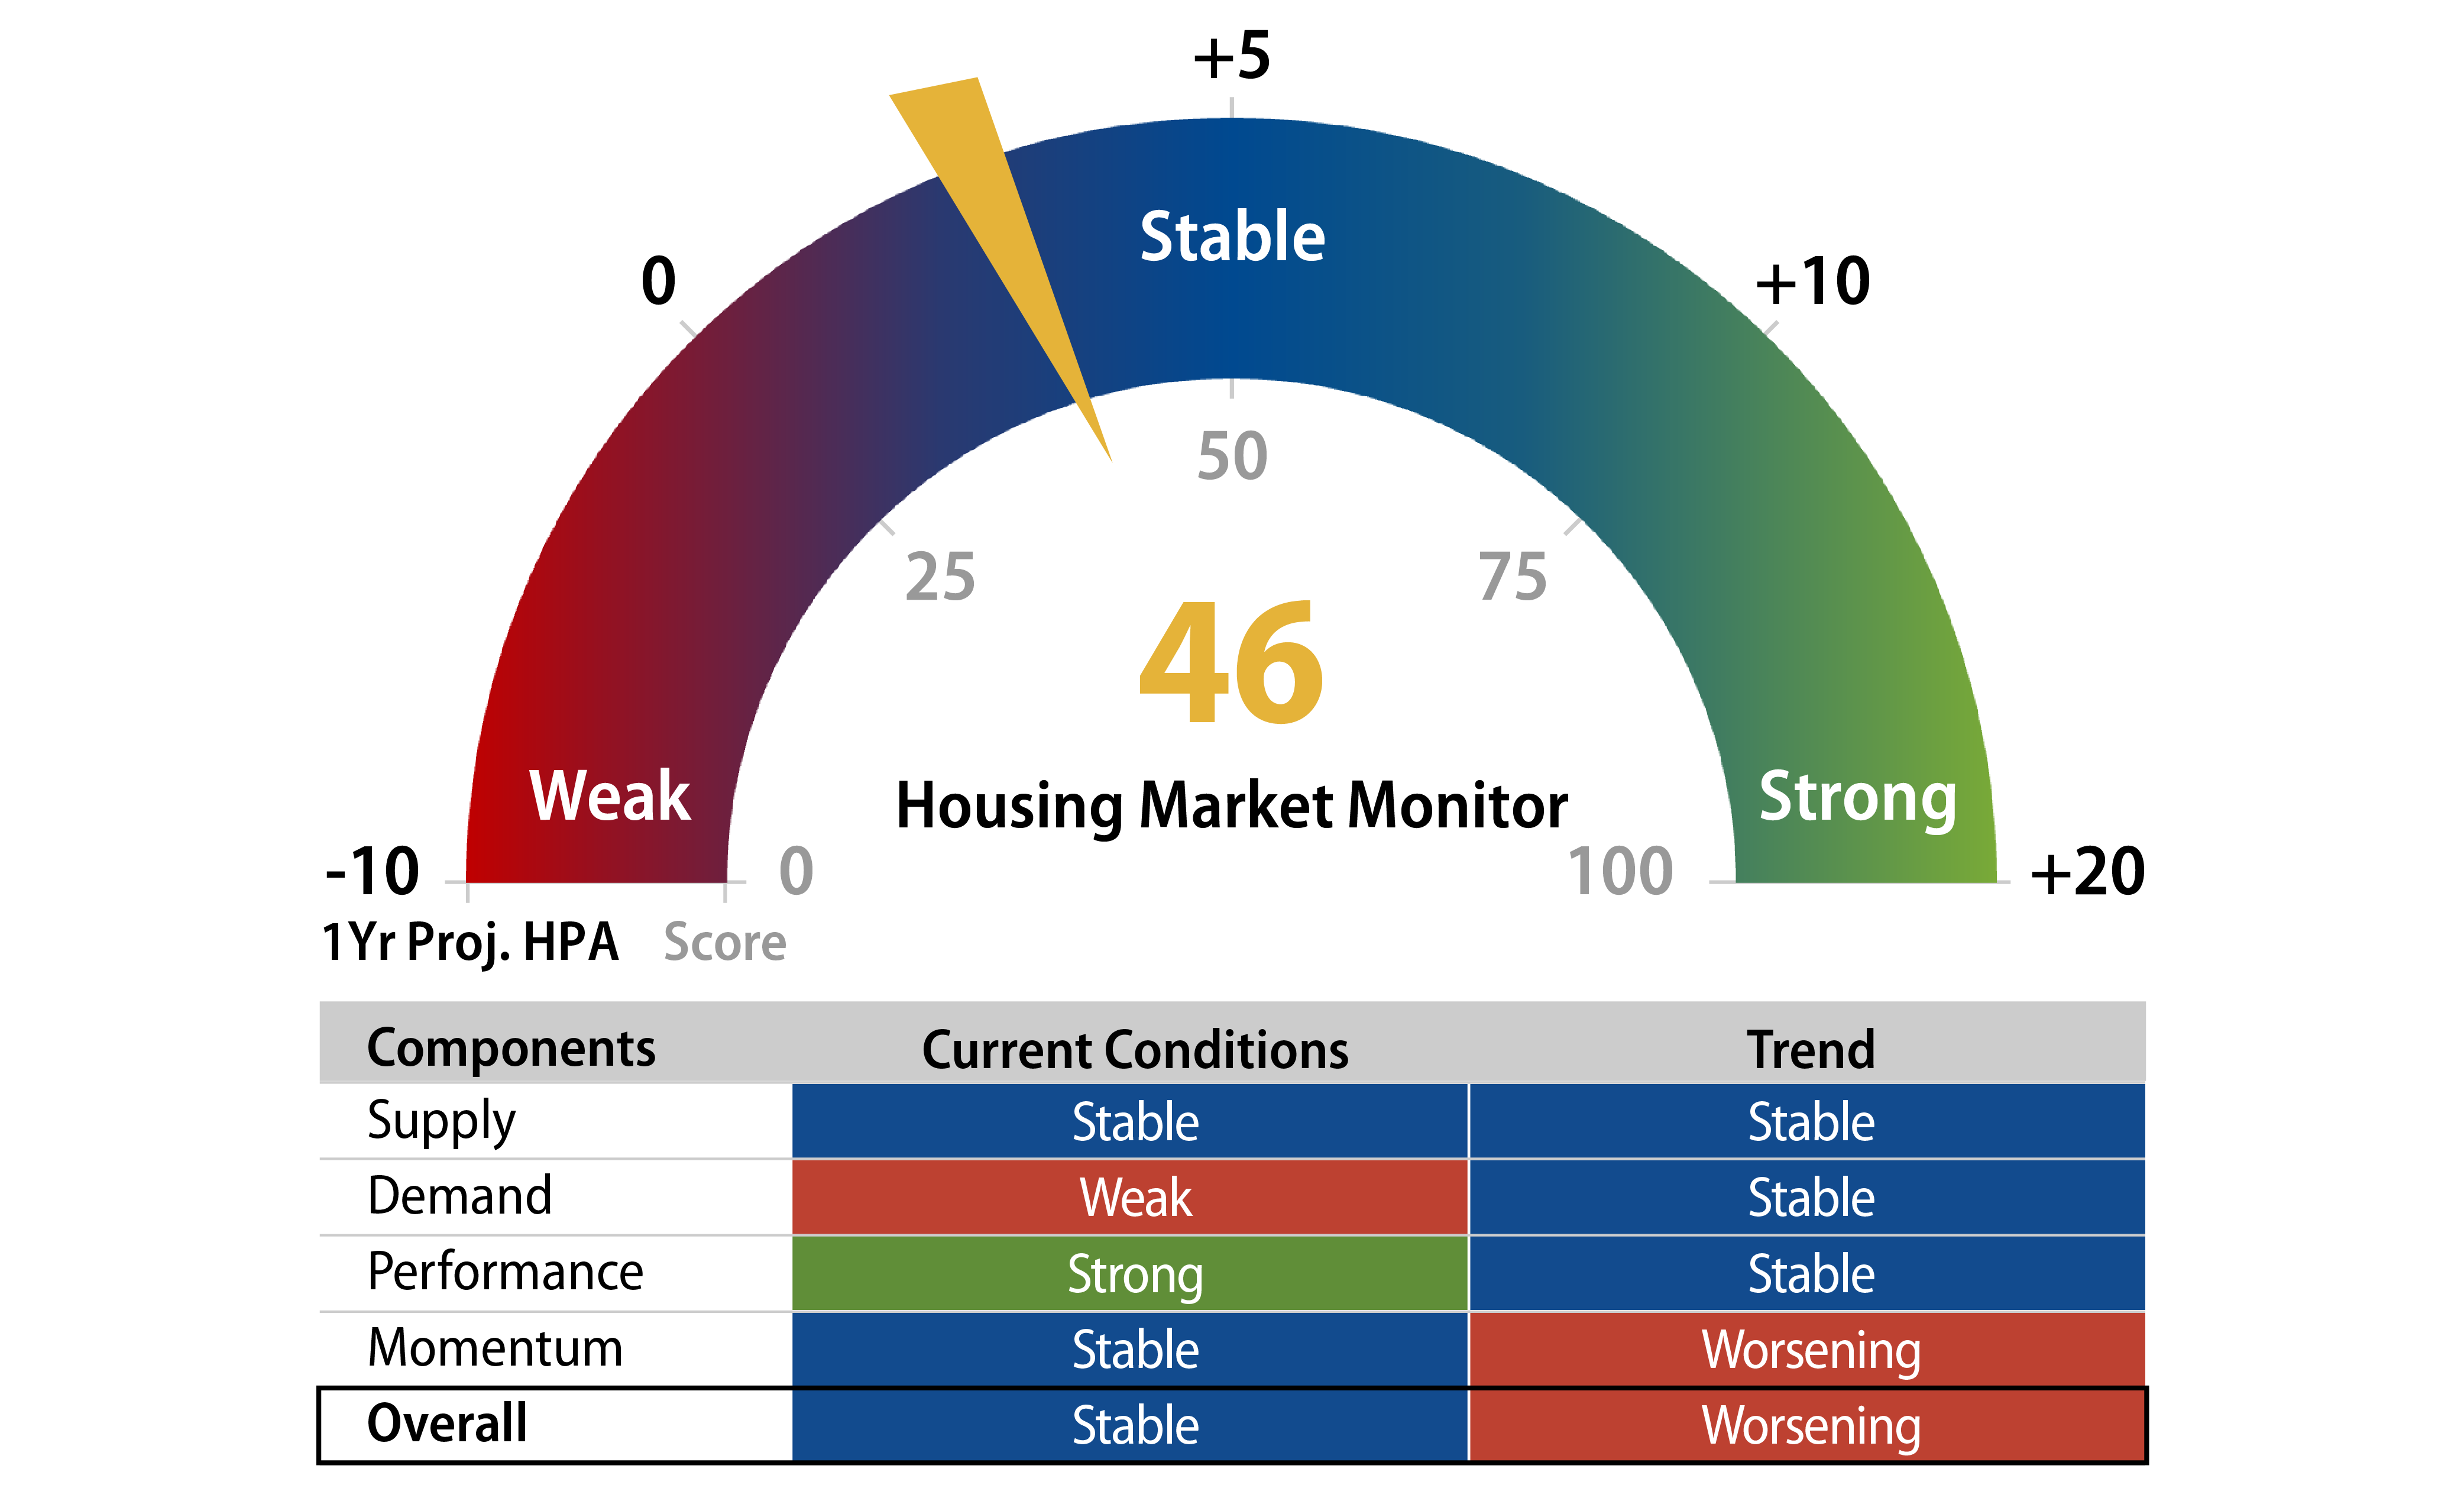
On a scale of 0 to 100, from “weak” to “strong,” we currently score the US housing market at 46. Not too hot and not too cold—just exactly what Goldilocks would have wanted. A score of 46 on our scale suggests future home price growth of roughly 4% to 5% annually. When calculating this housing score, we use a number of input variables that span an observation period of 30 years. We classify the variables into four major categories: supply, demand, stress and momentum. Using various statistical measures, we calculate a weighted score combining the four categories into one value: the Western Asset Housing Market Score.
The topic of housing supply and demand has gained a lot of media attention since the Covid pandemic. When forced to live, work, educate and recreate all in the same dwelling, Americans began to place a higher value on their housing situations. Many market observers have pointed to the mad dash made by both consumers and investors to buy homes as one of, if not the major contributor to, the historic spike in home prices experienced between 2021 and 2022.
The most often and frankly most insightful supply metrics quoted in the industry are the number of months of supply for new and existing homes in the US. Both of these metrics seek to estimate the number of months it would take for the current inventory of homes on the market to sell given the current sales pace. One can infer that a low number, such as the current reading of three months for the supply of existing-home sales means there are not a lot of existing-home purchase options for buyers; this inference is correct. Over an observation period of 30 years, a reading of three months for existing homes would rank in the eighth percentile. On the other hand, new homes currently have 8.3 months of supply over the same historic period of time, ranking in the 86th percentile. While that may seem like a significant number of new homes to sell, the percent contribution of new homes to the total volume of homes sold in the US is currently 15%. As a result, the impact of this supply is less significant on a macro level and more significant in very specific geographical segments. We are not discounting the impact of new-home sales volumes on the housing market. Rather, we are merely putting the current readings into the correct context of housing fundamentals spanning 30 years. At the peak of the global financial crisis (GFC), new homes’ months of supply hit 12.2 months and existing homes reached 10.7 months. Our model gives an overall weight of roughly 40% to the various supply inputs when calculating the final Housing Score.
On the other side of the economic equation, we have demand, which also adds various fundamental time series into our Housing Score. From our perspective, the demand indicators that make the most significant contributions to home price performance include the number of purchase applications generated in the industry and the sentiment of homebuilders across the country. Going back to 1990, the Mortgage Bankers Association tracks the weekly state of purchase and refinance mortgage application activity across the US. Spanning a 30-year timescale, you can see that during times of housing boom and bust the number of applications for mortgages rises and falls. This is intuitive because for the vast majority of consumers the purchase of a home requires a vehicle for financing, typically a mortgage. During the periods leading to the GFC, 2004-2005, the MBA Purchase Application Index consistently ranked anywhere from the 93rd to 98th percentile based on our 30-year timescale. Today, the index value ranks in the third percentile, showing that on a historical basis the number of applications is now extremely low. Embedded in the application data are effects from the level of mortgage rates, the credit standard lenders require from an applicant as well as the overall health of consumers’ balance sheets. Homebuilders are also a major demand indicator. Builders need to manage consumer demand over longer timelines with profit margins and sustainability factors built in. The National Association of Home Builders (NAHB) Traffic of Prospective Buyers Index is one of many indices that tracks sentiment and performance of the home building industry. Today the NAHB Traffic of Prospective Buyers Index reads 33, placing it in the 33rd percentile ranking over 30 years. A reading of 50 on the index indicates that more builders view conditions as good rather than poor.
One of the most influential factors in our Housing Score model is the current and historic performance of home prices in the US. While there are a few different home price indices used in the industry, the most recognized is the S&P CoreLogic Case-Shiller U.S. National Home Price Index. On a national and regional level, various indices track the changes in the value of residential real estate in the US. Dating back to late 1980s, we can review price changes across multiple Metropolitan Statistical Areas (MSAs) and analyze those changes alongside other economic factors. Over the past 30 years the US has arguably had three periods of outsized home price growth (2002-2005, 2012-2013 and 2020-2022) and two periods of considerable price depreciation (2006-2009 and 2022-2023). US home prices are currently experiencing a period of annual price growth of roughly 5%, which historically ranks in the 48th percentile for yearly price growth, a level we believe is synonymous with normal growth. As a major contributor to our Housing Score calculation, price momentum is currently “stable” with a trend line biased toward improving.
The final input category for our Housing Monitor is stress, which is essentially the past and current performance of outstanding residential mortgages. The most prevalent metric used to determine the level of stress mortgage borrowers are experiencing is to look at the level and timing of monthly payment delinquencies. Mortgage servicers track borrower payments and report statuses to various data providers across the industry who in turn aggregate and publish the statistics for investor analysis. Since March of 2022 mortgage borrowers have experienced historically low levels of delinquent payments. There are a number of reasons for this excellent borrower performance. For starters, the vast majority of outstanding mortgages have fixed rates of 4% or less (the prevailing rate is currently 7%). The strength of the consumer balance sheet coming out of the Covid pandemic had also kept borrowers flush with savings. But possibly the most significant factor is the tight lending standards created after the GFC, which have been used to underwrite the majority of outstanding mortgages. Based on 30 years of data, the level of mortgage delinquencies currently ranks in the bottom third percentile, which is up from the bottom percentile, which is where it ranked during all of 2023.

As Peter Drucker eloquently said, predicting the future is difficult at best. Our Housing Market Monitor Score can help the driver better understand the current conditions on the road ahead and whether to ride the breaks or step on the gas. The current reading of slightly below average means that we should take a careful approach to housing risk. The path remains resilient despite the challenges of higher mortgage rates and weaker demand, with the positives mostly offset the negatives for the time being. Our Western Asset Housing Market Score is one of the tools we use to help identify opportunities and manage risk in the fixed-income sector of securitized mortgages.