
The proliferation of passive investing over the last decade has only sped up in recent years, in part due to market volatility and a wider array of investment alternatives to active products. While the research on the active versus passive debate does not favor equities, particularly with respect to funds investing in highly liquid large-cap equities, the conversation changes for fixed-income, especially in the emerging markets (EM) debt sector.
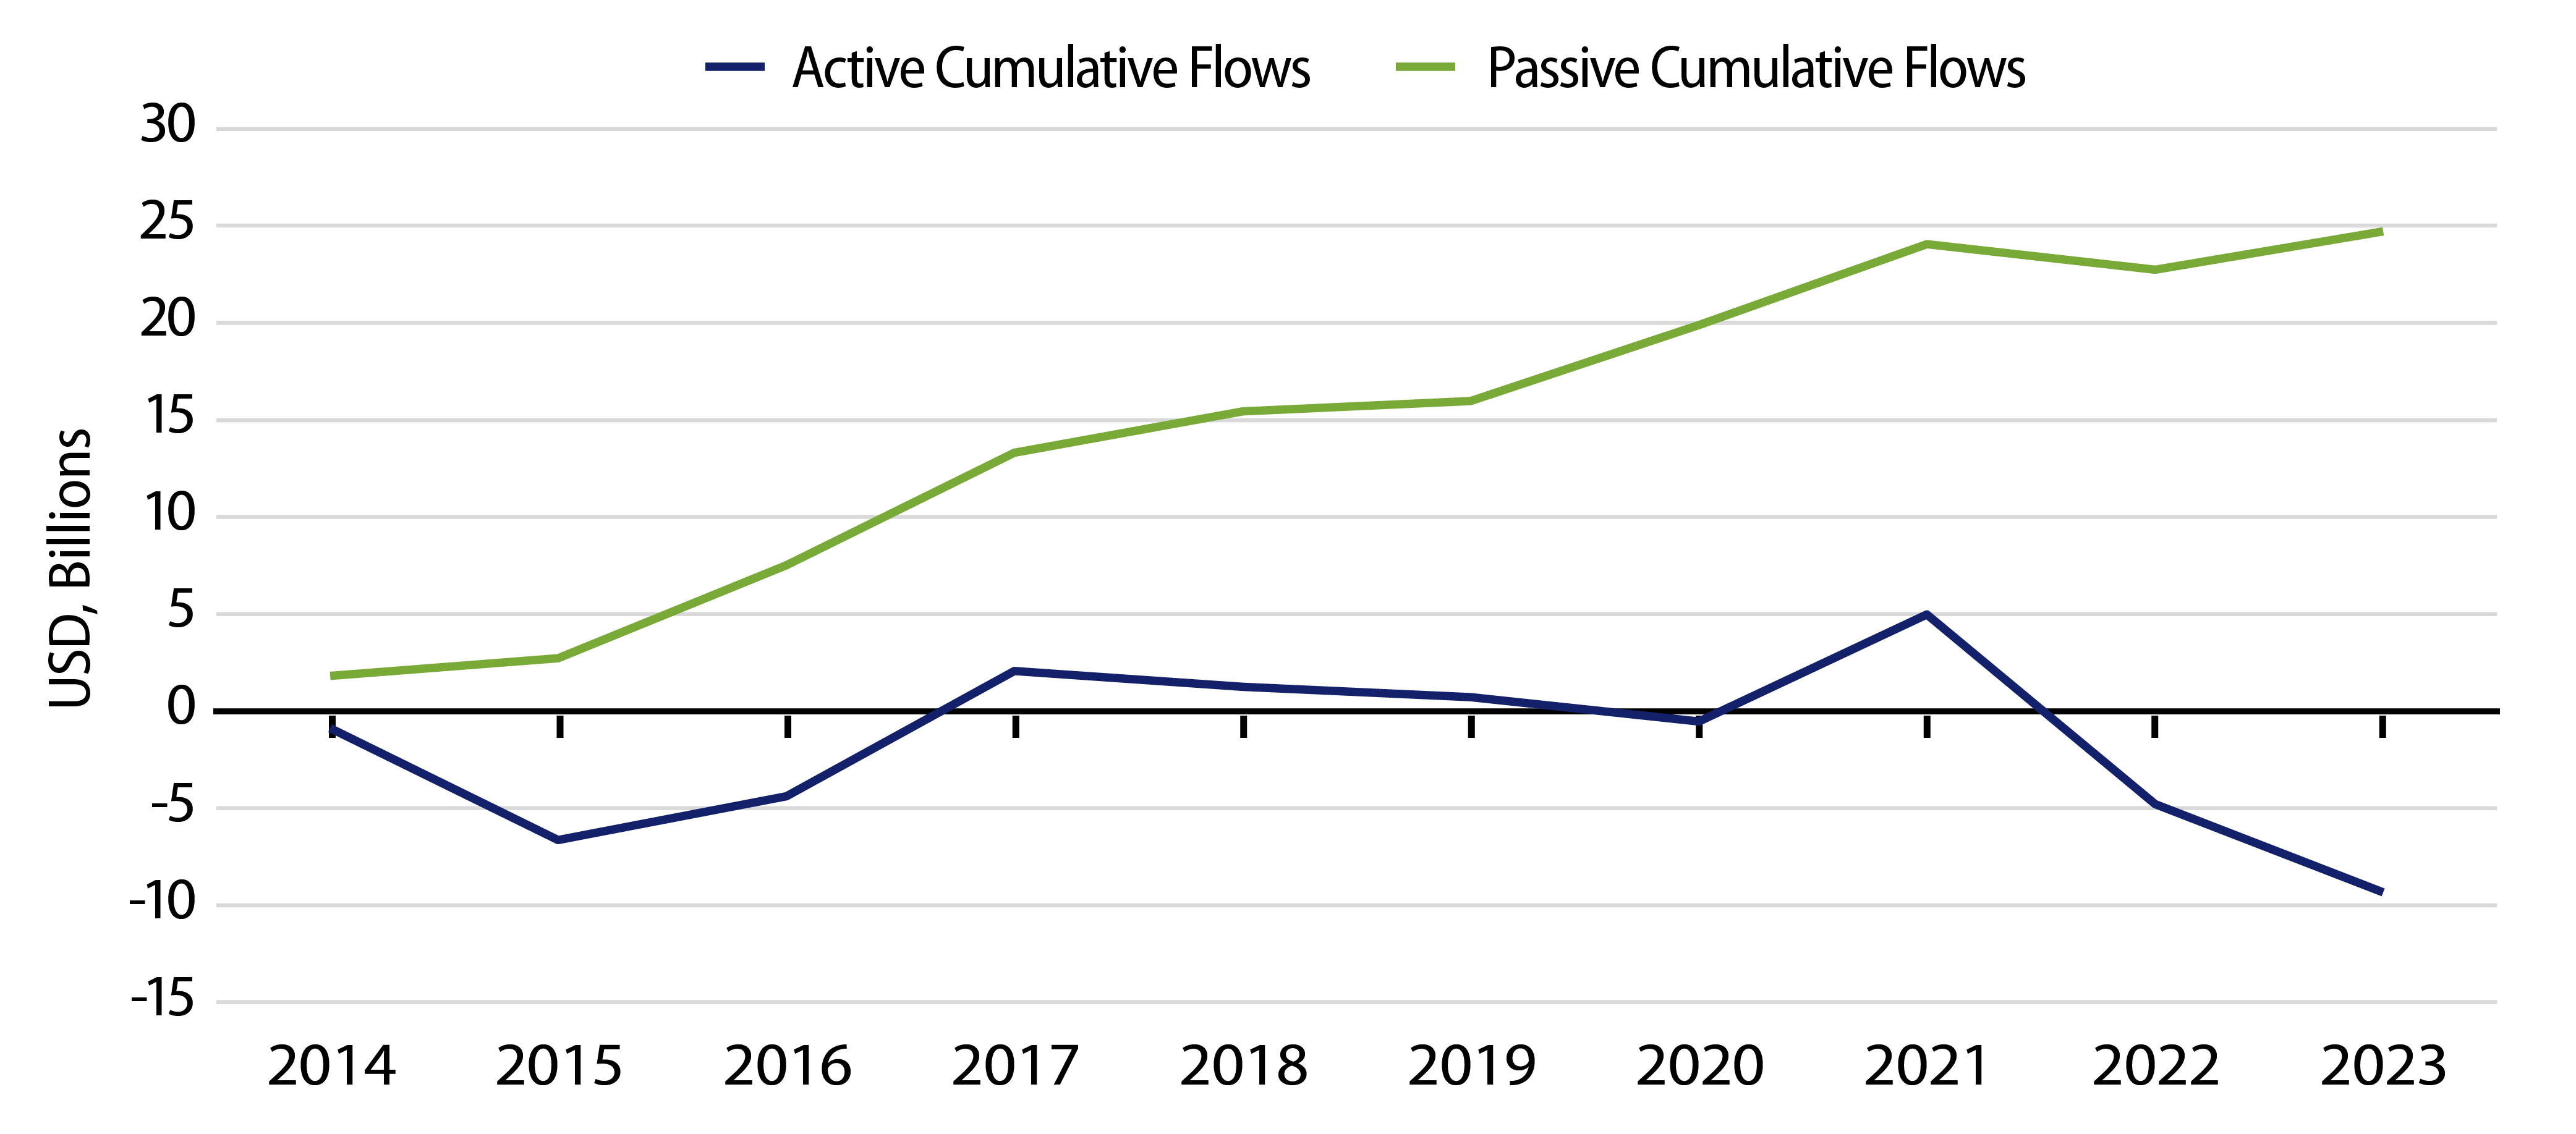
As highlighted in Exhibit 1, the growth of EM passive funds has remained strong over the past decade while active funds have lost flow share. For an investor who may view the asset class as another form of beta exposure, passive would appear to make sense. Fees are typically lower, though still expensive by passive standards (a median of 41 bps versus 77 bps for active). Passive exchange-traded fund (ETF) products are also simple and easy to transact in, mainly because of their greater accessibility on investor platforms and intra-day pricing allowing for quick trading.
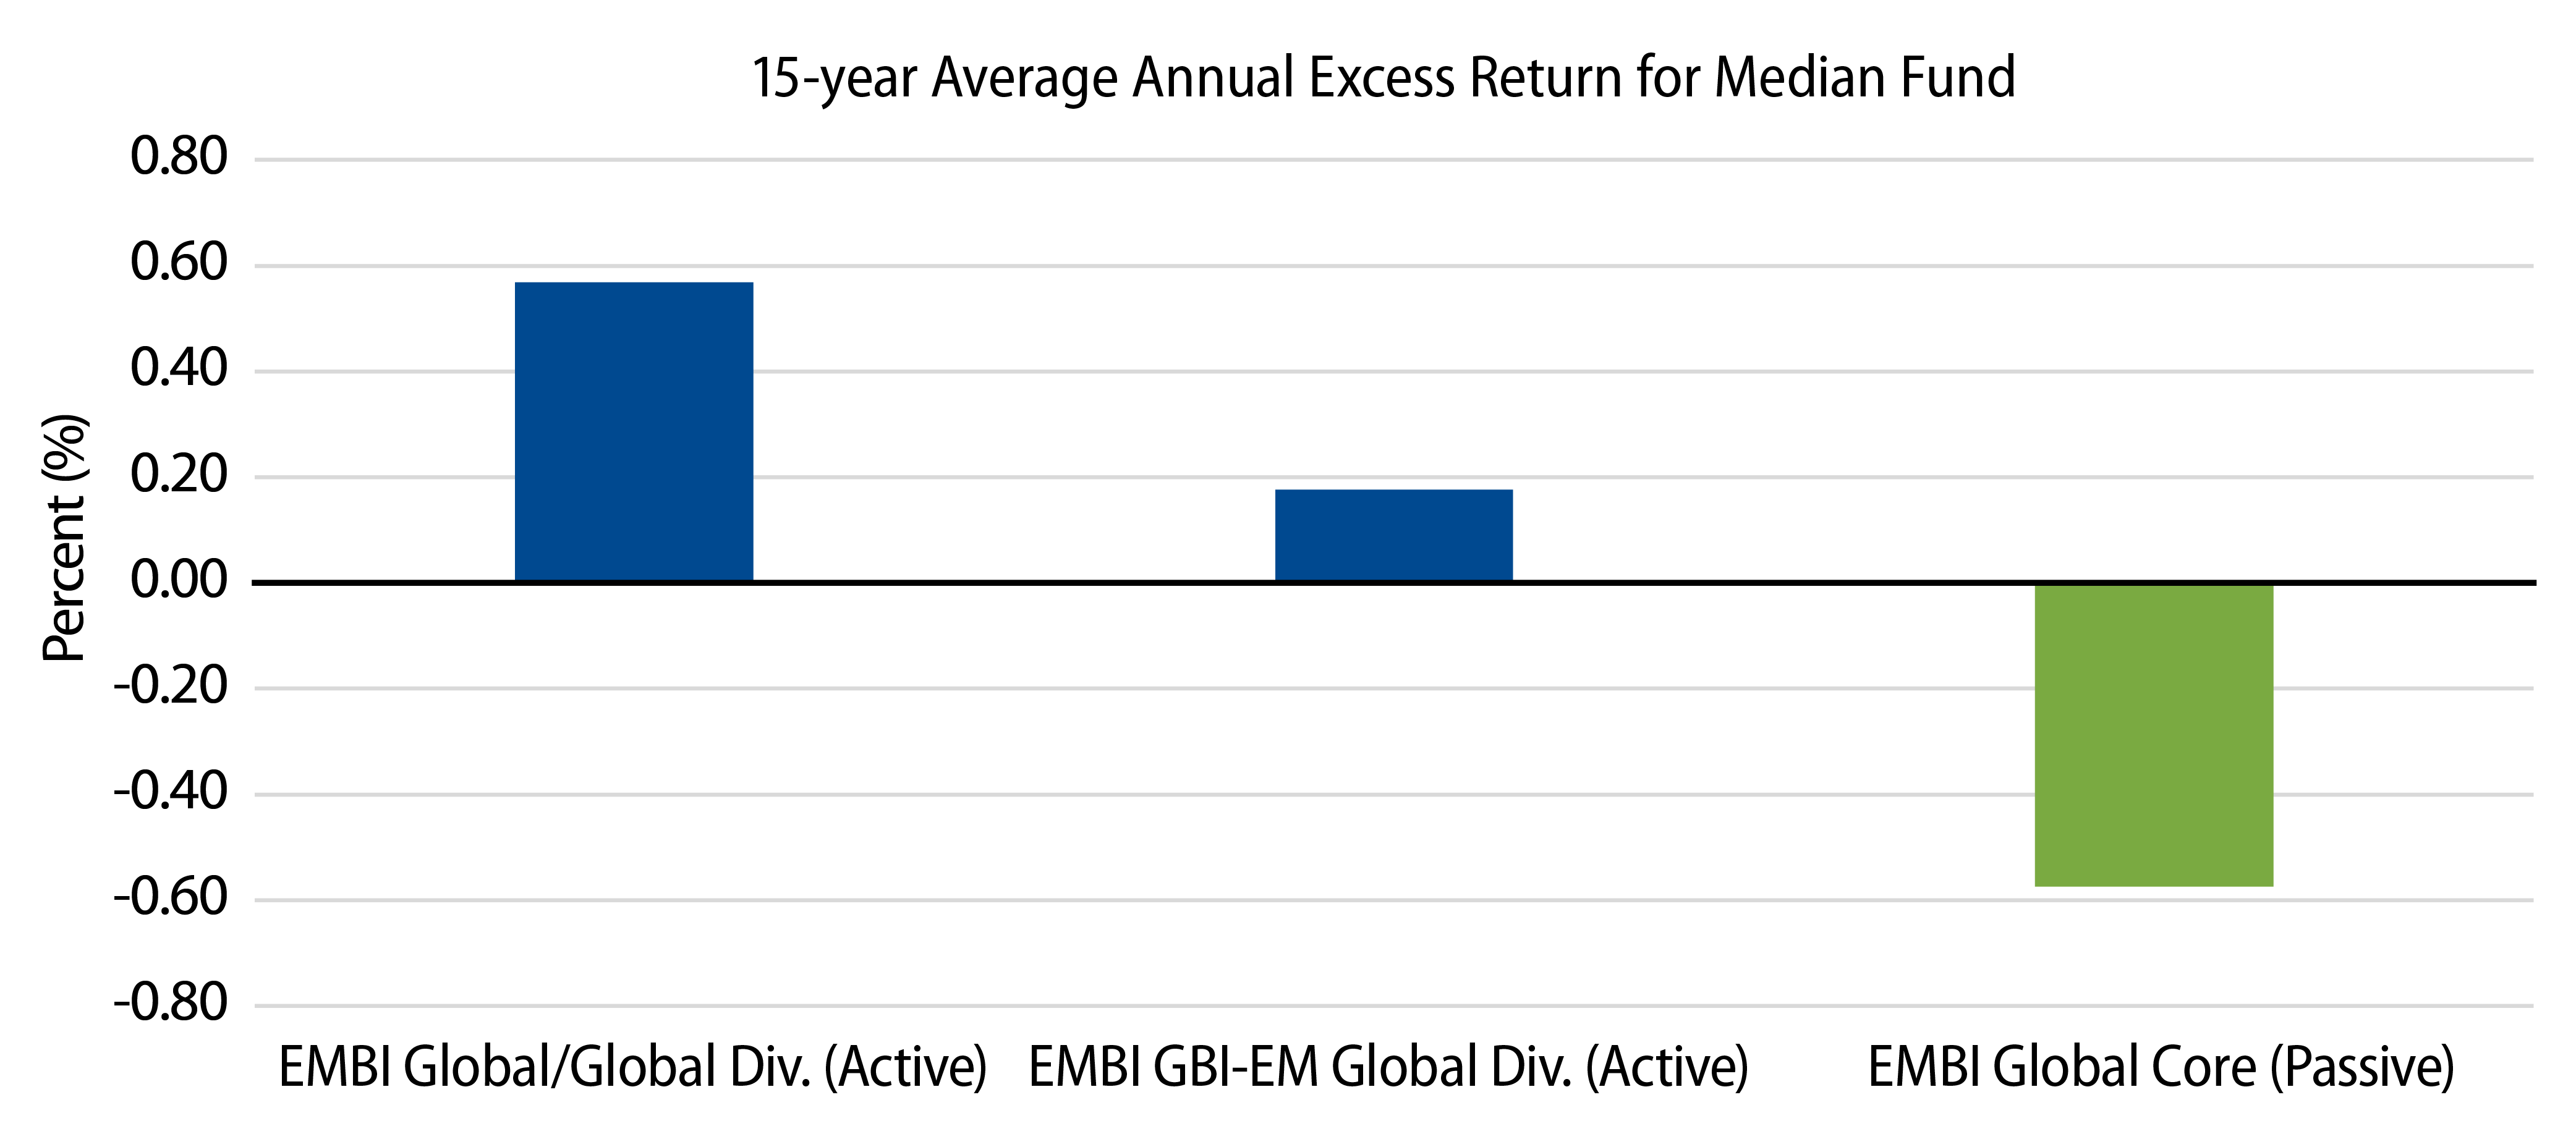
However, the idiosyncrasies inherent to EM debt investing provide space for active managers to generate alpha. For hard-currency funds benchmarked to the industry standard JPM EMBI Global and Global Diversified indices (over 90% of the hard-currency active USD-denominated universe by AUM), the median active fund outperformed its benchmark by an average of 52 bps after fees per year for the last 15 years. A similar story exists in local markets where funds benchmarked to the JPM GBI-EM Global Diversified Index (60% of the USD-denominated local-currency universe by AUM) averaged 18 bps of outperformance over the last 15 years.
There are four key issues that hinder the effectiveness of passive investments within EM.
First, ETF index funds are typically only indexed to the most liquid areas of the asset class. For example, the largest benchmark by AUM for the ETF universe is the JP Morgan EMBI Global Core index, which excludes smaller issues and shorter-maturity instruments, thereby reducing return and diversification potential. The performance drag of these more limited indices is evidenced by the outperformance of the largest index by AUM for active funds, the EMBI Global Diversified. It has outperformed the EMBI Global Core Index by 9 bps per year for the last 15 years.1
Second, passive ETFs have often underperformed their own benchmarks, as transaction costs and index complexity make tracking difficult. For example, the median ETF benchmarked to the JPM EMBIG Core Index underperformed its benchmark by an average of 57 bps per year for the last 15 years. In effect, this can be viewed as a hidden fee.
Third, investors should consider the degree of security liquidity and accessibility; small country sovereigns, thinly traded corporates or countries with capital controls can cause issues for passive ETFs that require greater market depth to transact at scale. During times of stress, ETF pricing can vary significantly from the pricing of the underlying basket of securities due to market illiquidity, as was seen in March 2020. The forced selling during times of stress can amplify underperformance.
Fourth, EM should not be viewed as a beta play as there is no well-defined “emerging markets” exposure. The asset class comprises countries with differing balance sheet strengths, regulatory regimes, debt and debt servicing profiles and sociopolitical risks, to name just a handful of risk factors. As highlighted in our recent blog, frontier markets take these diverse risk factors even further.
In closing, while EM debt has not been spared of the general trend toward passive investments, the data and intuition do not appear to support this trend. Active management can take advantage of alpha opportunities available in inefficient markets, and EM debt continues to be one.
Special thanks to Jane Brauer at Bank of America and Wilfred Wong at Western Asset for their assistance with this blog post.
ENDNOTES
A Note About Methodology: The active fund universe is defined as USD-denominated funds that are not categorized as Index Funds, Enhanced Index Funds, Fund-of-Funds or Feeder Funds, according to Morningstar, and it assumes the cheapest share classes. Active outperformance is calculated as the average of the median excess return each calendar year for funds that existed in a given year.