
Emerging markets (EM) debt delivered strong gains of up to 4% in January 2023, according to JPMorgan data, in stark contrast to last year’s dismal returns. To a large extent, the turnaround has been fueled by improved risk appetite globally since the start of the year, on market anticipation of a boost to global growth from China’s exit from its zero-Covid policy, as well as the recent downshift in Fed tightening.
Cyclical Drivers Underpin EM Debt
To be sure, there are fundamental developments that merit a rebound in EM asset prices. EM central banks’ policy reaction function tops the list of what EM countries did right amid significant Covid uncertainties. Having pursued ultra-loose policies through 2020, EM central banks promptly shifted gear the following year in the face of incipient inflation pressures. Brazil kickstarted the EM monetary tightening cycle in March 2021 by raising its policy rate to 2.75% from an all-time low of 2.00%.1 In the months that followed, central banks in Chile, Czech Republic and South Korea, among others, followed suit.
The exemplary response by monetary authorities is undoubtedly a commendable development, given that past EM crises—the Asian crisis of 1997-1998 and the Argentina default in 2001, as examples – had been attributed to market skepticism of policy credibility. Against historical precedent, EM central banks took a leadership role in the global monetary cycle.
Admittedly, policy tightening comes with a cost of slower growth. The good news is that such concerns should be allayed by a resumption of economic normalcy in China, following an extended period of lockdowns in the country. In its end-January assessment, the IMF now expects the Chinese economy to expand 5.2% in 2023, markedly higher than its prior forecast of 4.4% in October 2022. Specifically, demand for services is poised for a sharp upturn. Already, this is evident from the January non-manufacturing Purchasing Managers’ Index (PMI) print, which surged nearly 13 points month-over-month to 54.4. We also anticipate substantive pent-up demand for international travel, which has so far remained depressed at roughly one-tenth of its pre-Covid level.
In addition to fundamental factors, the year-to-date gains in EM asset prices also owe to favorable technical factors. Investors have significantly lightened up EM positions in recent years, in response to severe global macro headwinds. At the same time, the primary market for Eurobond issuance has been effectively shut through the second half of 2022. With EM debt generally under-owned, it is not surprising that this year’s new issues have been well subscribed.
As a consequence of the corollary to a reduced allocation to EM, price valuations have become attractive. Notwithstanding the recent rally, EM local currency yields remain more than 200 bps wide of the levels seen in early-2021. For USD-denominated high-yield sovereign bonds, current spreads of roughly 800 bps are twice as much as the five-year tight in early 2018. In particular, the high watermark in all-in EM yields is gaining the attention of long-term, buy-and-hold investors looking to lock in book yields.
Secular Concerns Warrant Differentiation
While acknowledging the upbeat tone in markets, we would stop short of suggesting a return of the EM love fest that featured prominently in the 2000s, for the following reasons.
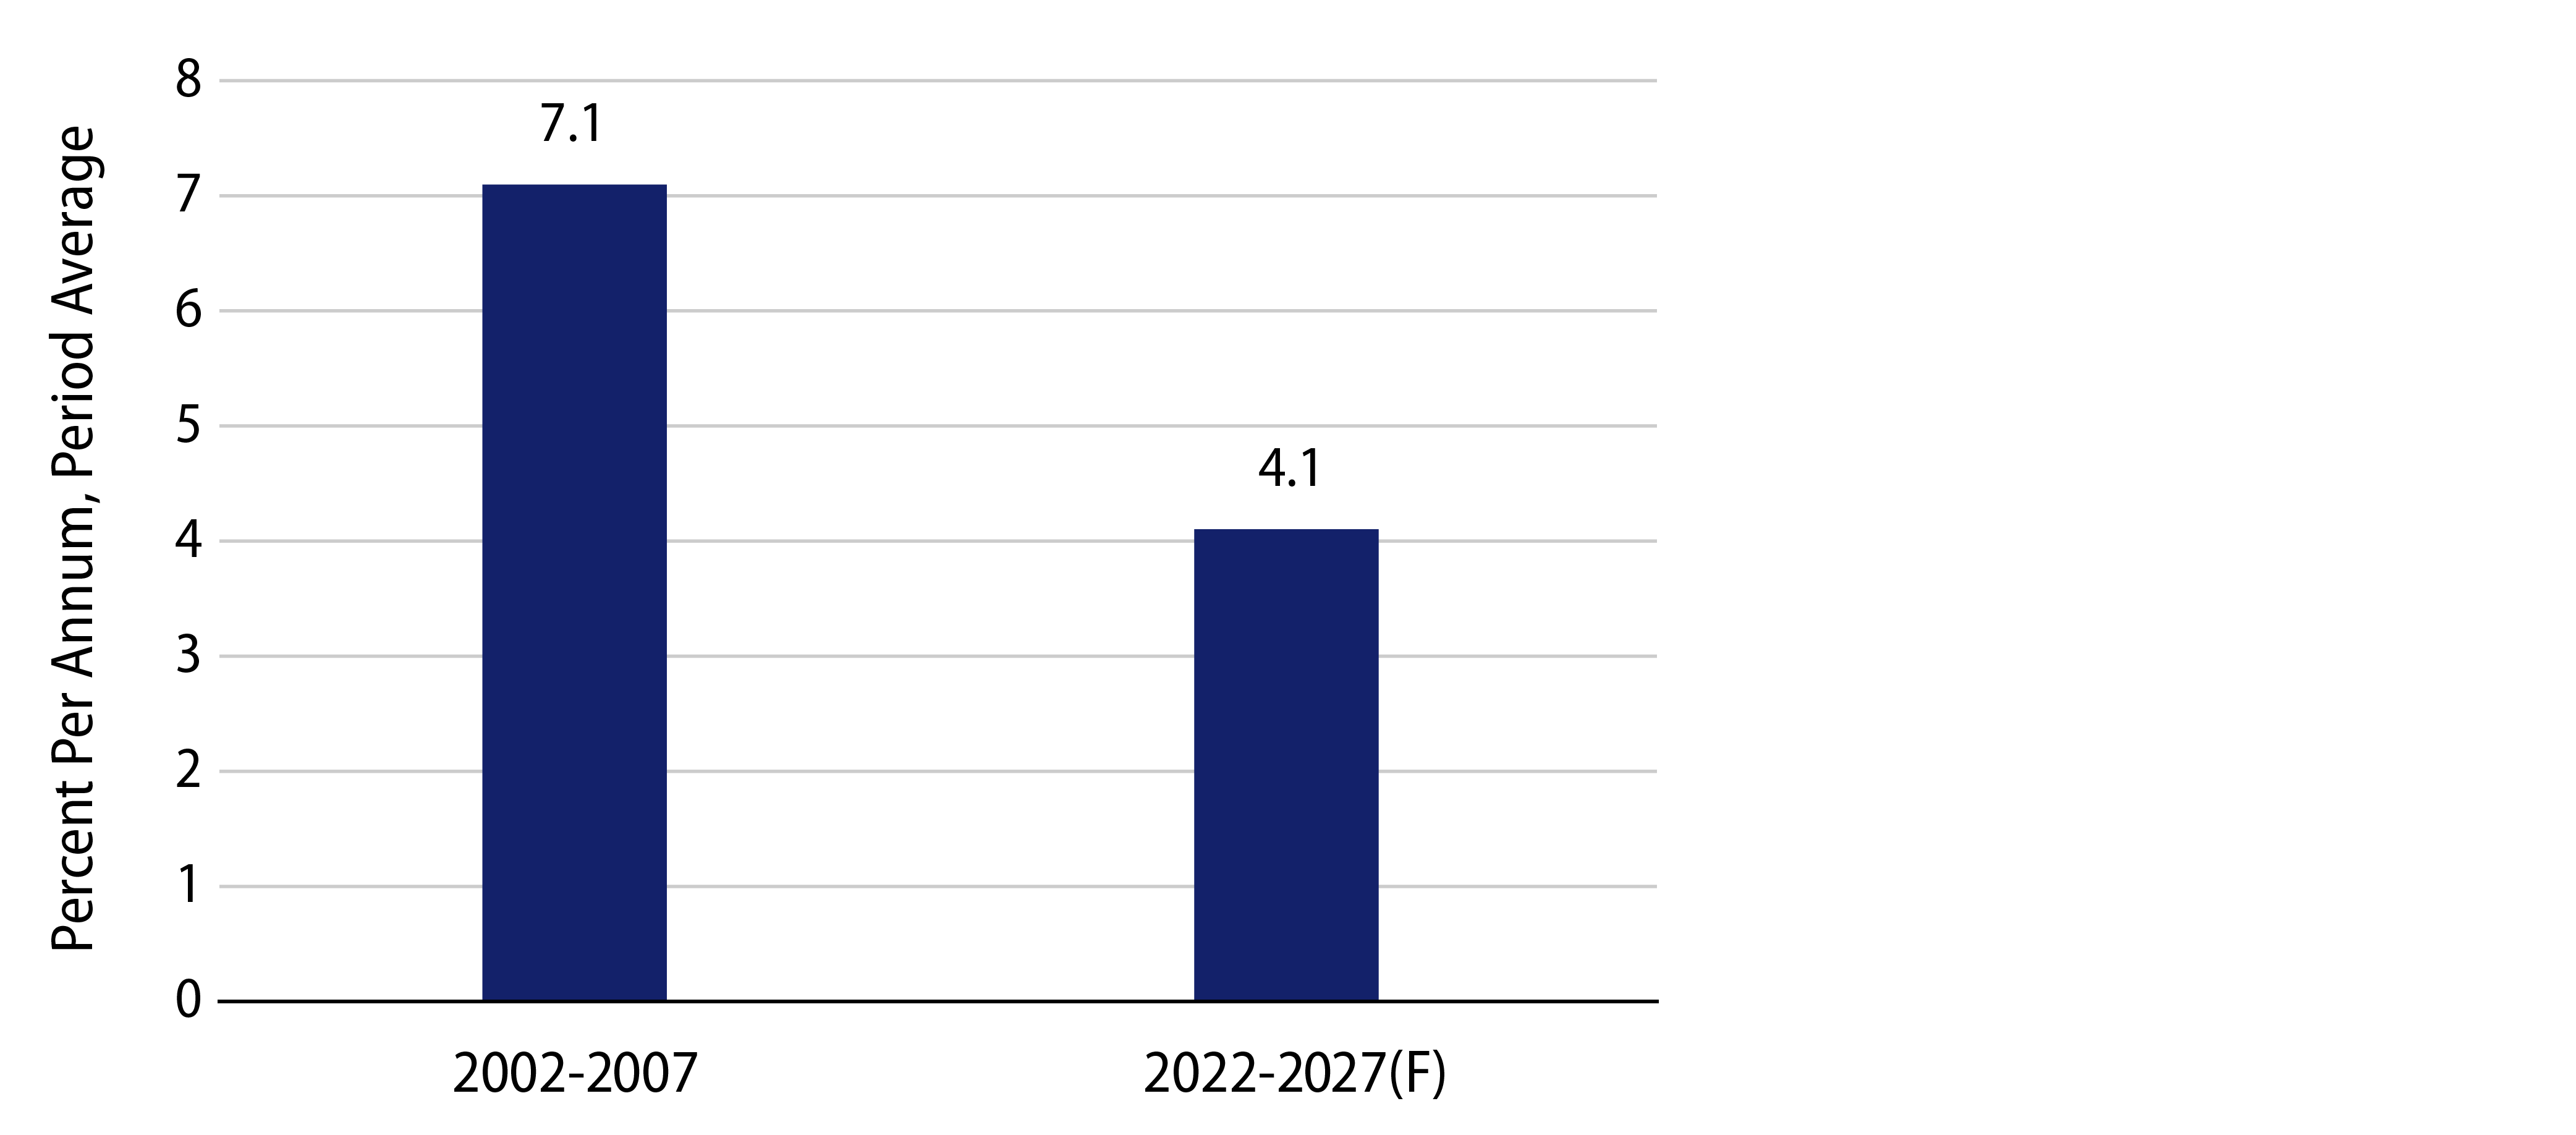
- The growth potential of EM has downshifted. Annual EM growth is projected at around 4% in the next five years, which is a hefty 3 percentage points below the average expansion from two decades ago (Exhibit 1). In the past, the infrastructure-led expansion in China helped fuel a commodity boom that benefitted many EM countries. That relationship is now likely more cyclical and less secular. The immediate boost from China’s reopening is expected to be on household consumption; capex recovery will take time and may not be the global growth driver it once was.
- Sociopolitical shifts have led to heightened idiosyncratic risk. One consequence of Covid is that it has accentuated a longstanding notion of rising income gaps. Recent election outcomes have generally benefitted the populist left, a trend that is particularly evident in Latin America. With fiscal finances already an Achilles’ heel in many EM countries, the threat of policy heterodoxy is high. Countries with weak institutions and/or authoritarian leadership are vulnerable to costly missteps.
- The impact from shifting geopolitics is uneven across EM. The Russian-Ukraine situation has had a very negative effect on countries most reliant on energy and food imports, but benefitted oil exporters in the Gulf. Ongoing US-China tensions should benefit lower cost countries in Southeast Asia as multinational corporations with global supply chains have progressively pursued a “China + 1” strategy. These trends contrast with the massive tailwinds in international trade seen shortly after China’s WTO accession in 2001.
Strategic Implications
From an investment standpoint, we would eschew a strictly binary love-it-or-hate-it attitude regarding EM debt, but adopt a more nuanced approach toward the highly heterogenous set of fixed-income opportunities. We expect to pick up value trades through a plethora of primary issues in the upcoming months.
- Hard currency IG bonds in EM are a staple allocation and provide the benefit of global diversification. Among sovereign and corporate securities, we believe select opportunities in the Middle East (Qatar and UAE), Asia (Indonesia and South Korea) and Latin America (Mexico) offer attractive value. We see value in government-owned credits with systemic importance to the country; these bonds offer attractive pick-up in yield over their sovereign issuers.
- Current valuations in frontier markets (FM) provide the potential for strong total returns. FM countries are loosely defined as those in JPMorgan’s Next Generation Markets index, and may only appeal to investors with a higher risk tolerance. Given the highly diverse mix of FM debt, the investment approach can be driven by a broad range of themes, both global macro as well as idiosyncratic factors. As a rule, our investment thesis places a heavy focus on the return of capital.
- In local markets, inflation-adjusted yields in Latin America appear attractive relative to developed markets (DM), although market volatility is expected to stay high. In terms of the opportunities in EM foreign exchange (FX), we expect Asian currencies to outperform given higher GDP correlations with China’s reopening. Outside of Asia, the relatively high cost of carry should help underpin currencies in countries that adhere to orthodox policies.
ENDNOTES