
In our recent client travels (virtual, of course!), Western Asset has noted that our insurance investor base is increasingly viewing emerging markets (EM) debt as an attractive opportunity in a post-pandemic, reflationary environment. Our team is tactically positioned for a cyclical recovery in EM credit; however, we also feel strongly about strategic EM fixed-income opportunities that may be appropriate for our insurance clients and prospects. The type of EM allocation we are talking about goes beyond the standard ETF or “off-the-shelf” EM fund solution and speaks directly to insurance investors who have a more refined palate with regard to their income, return and capital needs. We believe now is the time for general account insurance assets to look at EM not as an opportunistic, total return play, but rather as a core, “extension of US credit” secular allocation. In our view, this type of customized allocation will meet not only total return objectives but also income and risk objectives for our clients.
EM’s Income Advantage
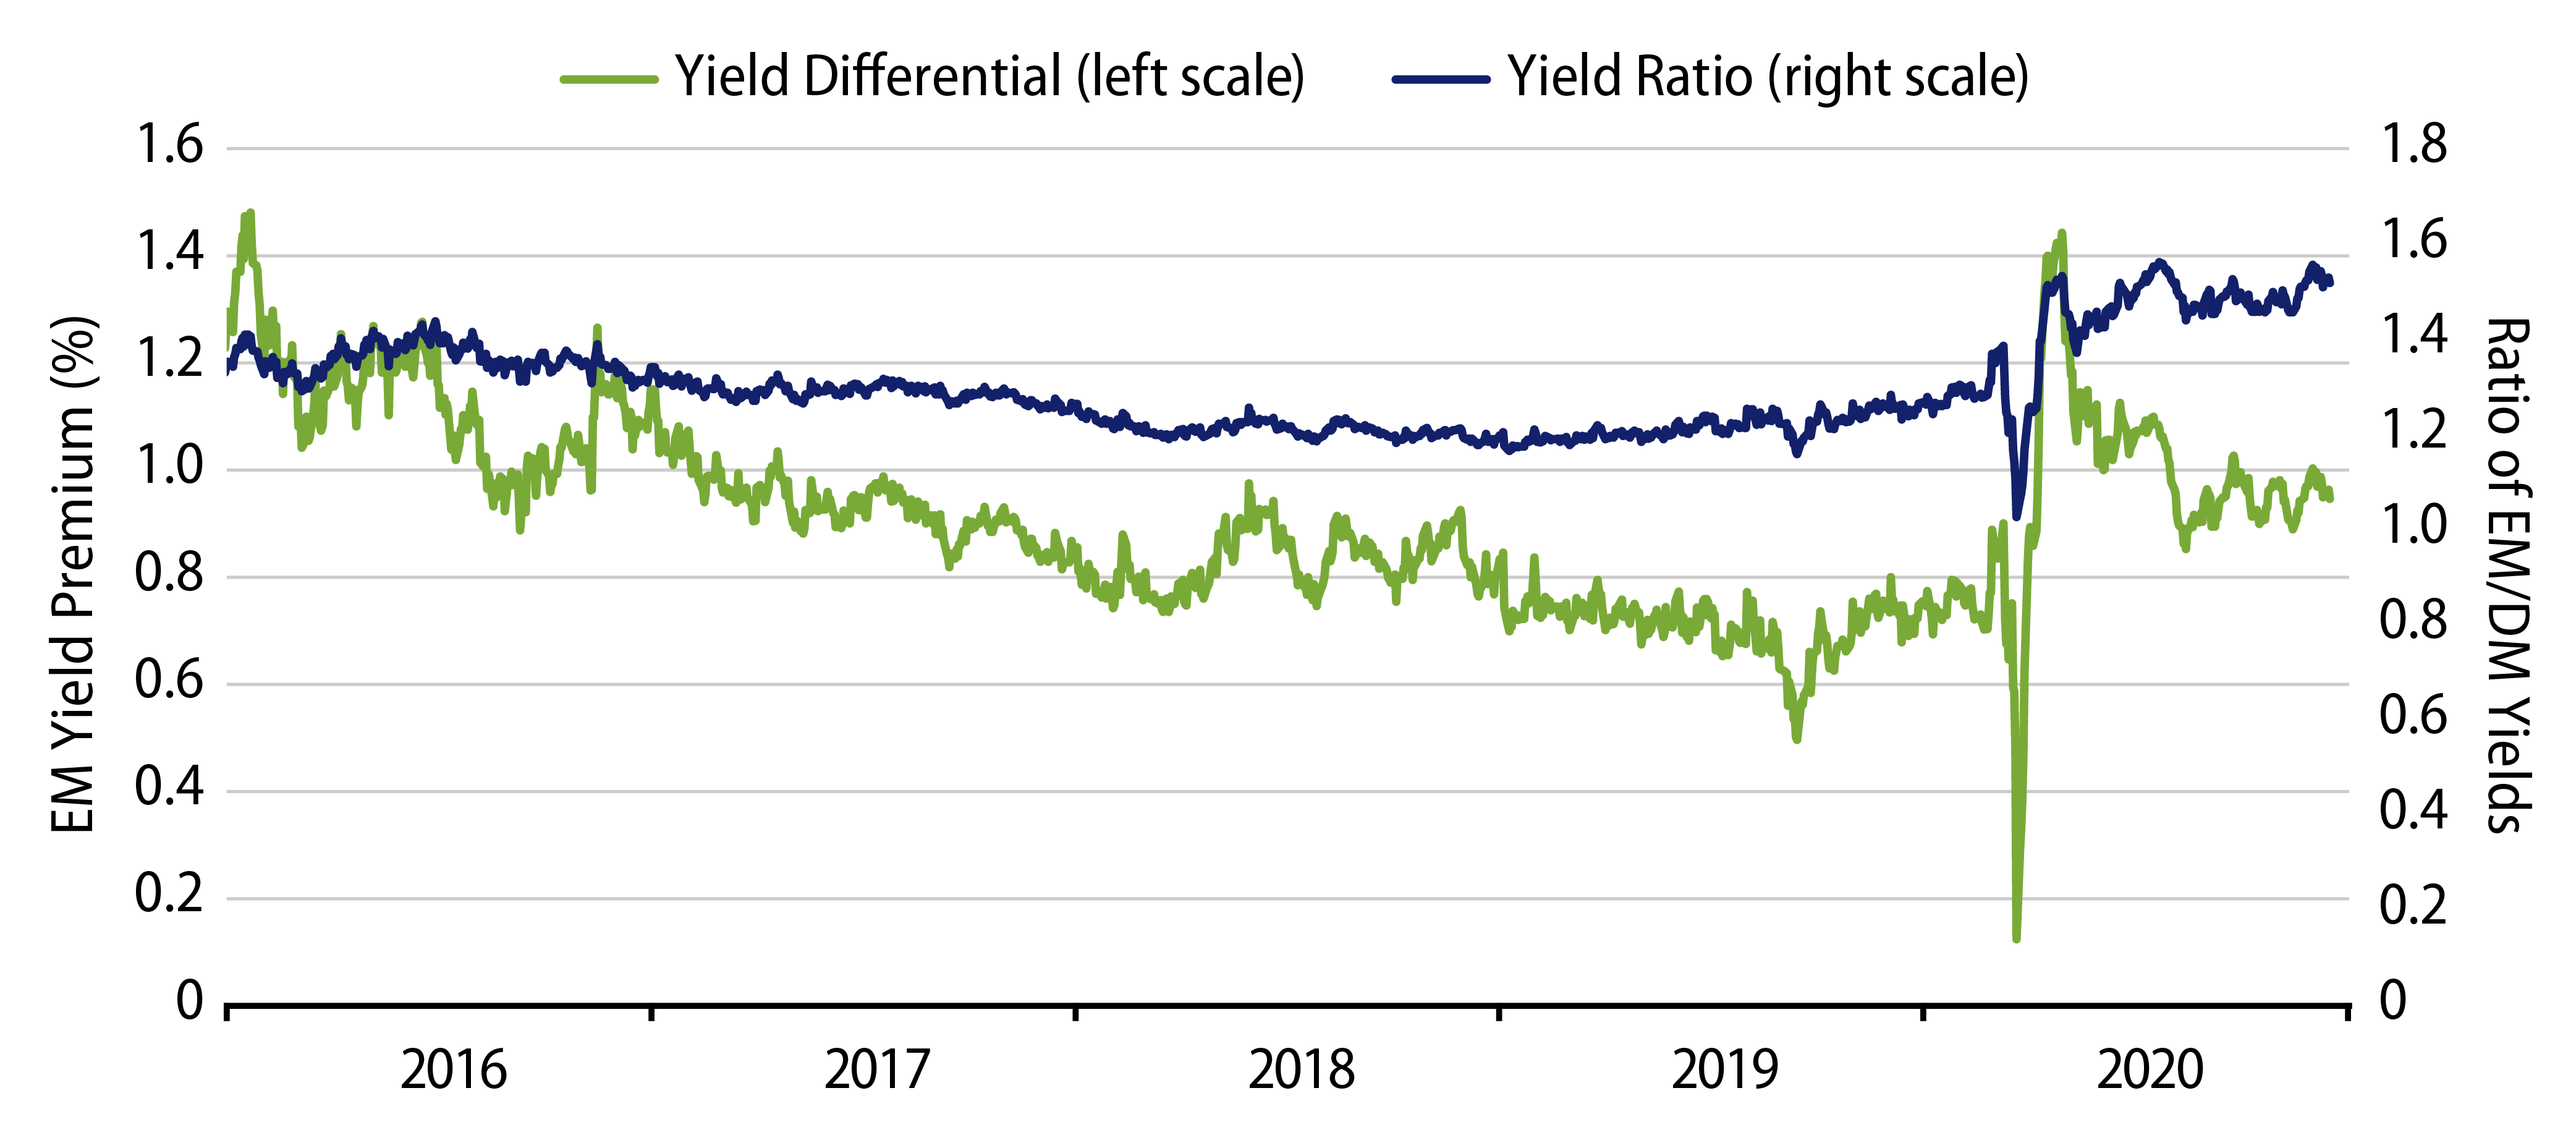
Many investors are aware of the income pickup that investment-grade-rated EM debt offers relative to similarly rated developed market (DM) opportunities. This premium has historically been at least 50 basis points, but you may be surprised to hear that current EM differentials trade toward the wider end of a five-year range (Exhibit 1 – green line), despite the recent compression in global yields.
We would note the current investment-grade-rated EM opportunity set has fundamentally strengthened from prior periods, with cuspy issuers such as Brazil, Turkey and South Africa no longer part of the universe, likely reducing volatility going forward. Furthermore, the ratio between EM and DM yields (Exhibit 1 – blue line) is at a historically wide level. Investors are receiving the same income pickup in today’s low-yield environment that they were during periods of much higher rate structures. Said differently, we believe investors currently have the opportunity to allocate to a segment of EM with historically strong fundamentals at an attractive entry level.
Comparing Default Risk
If the attractive attributes of EM credit (e.g., income, diversification and total return potential) are relatively well known, we believe investors’ perceptions of the sector’s risks are likely overstated and misunderstood. A common investor concern is the likelihood of downgrades and impairments in the EM sector relative to DM; however, data suggests such occurrences in EM are no more frequent than in DM. Exhibit 2 shows S&P’s cumulative historical default rates by ratings for EM and US credit. As the table illustrates, EM has a lower default rate in A and BB ratings categories and relatively equivalent rates in the BBB category.
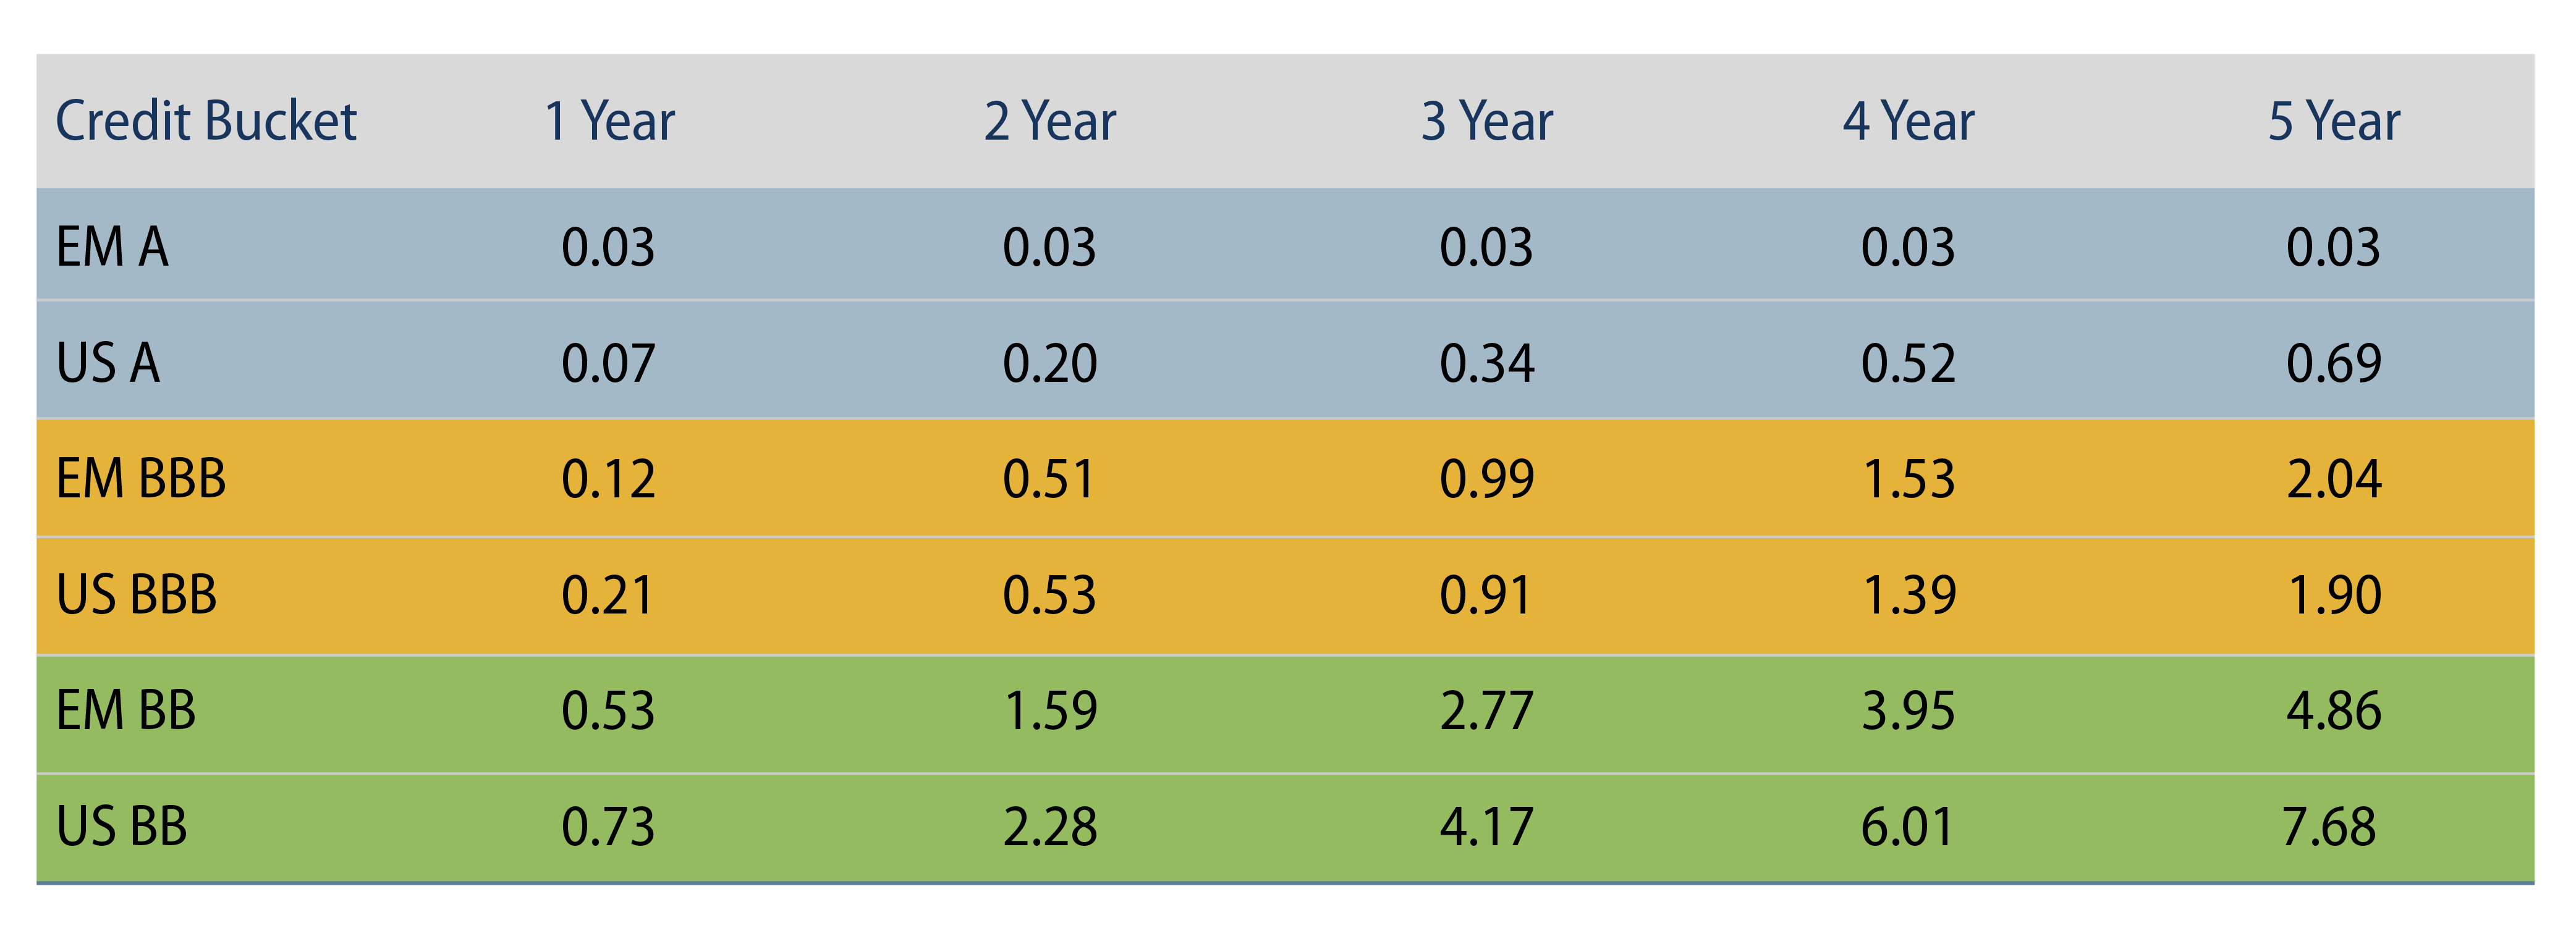
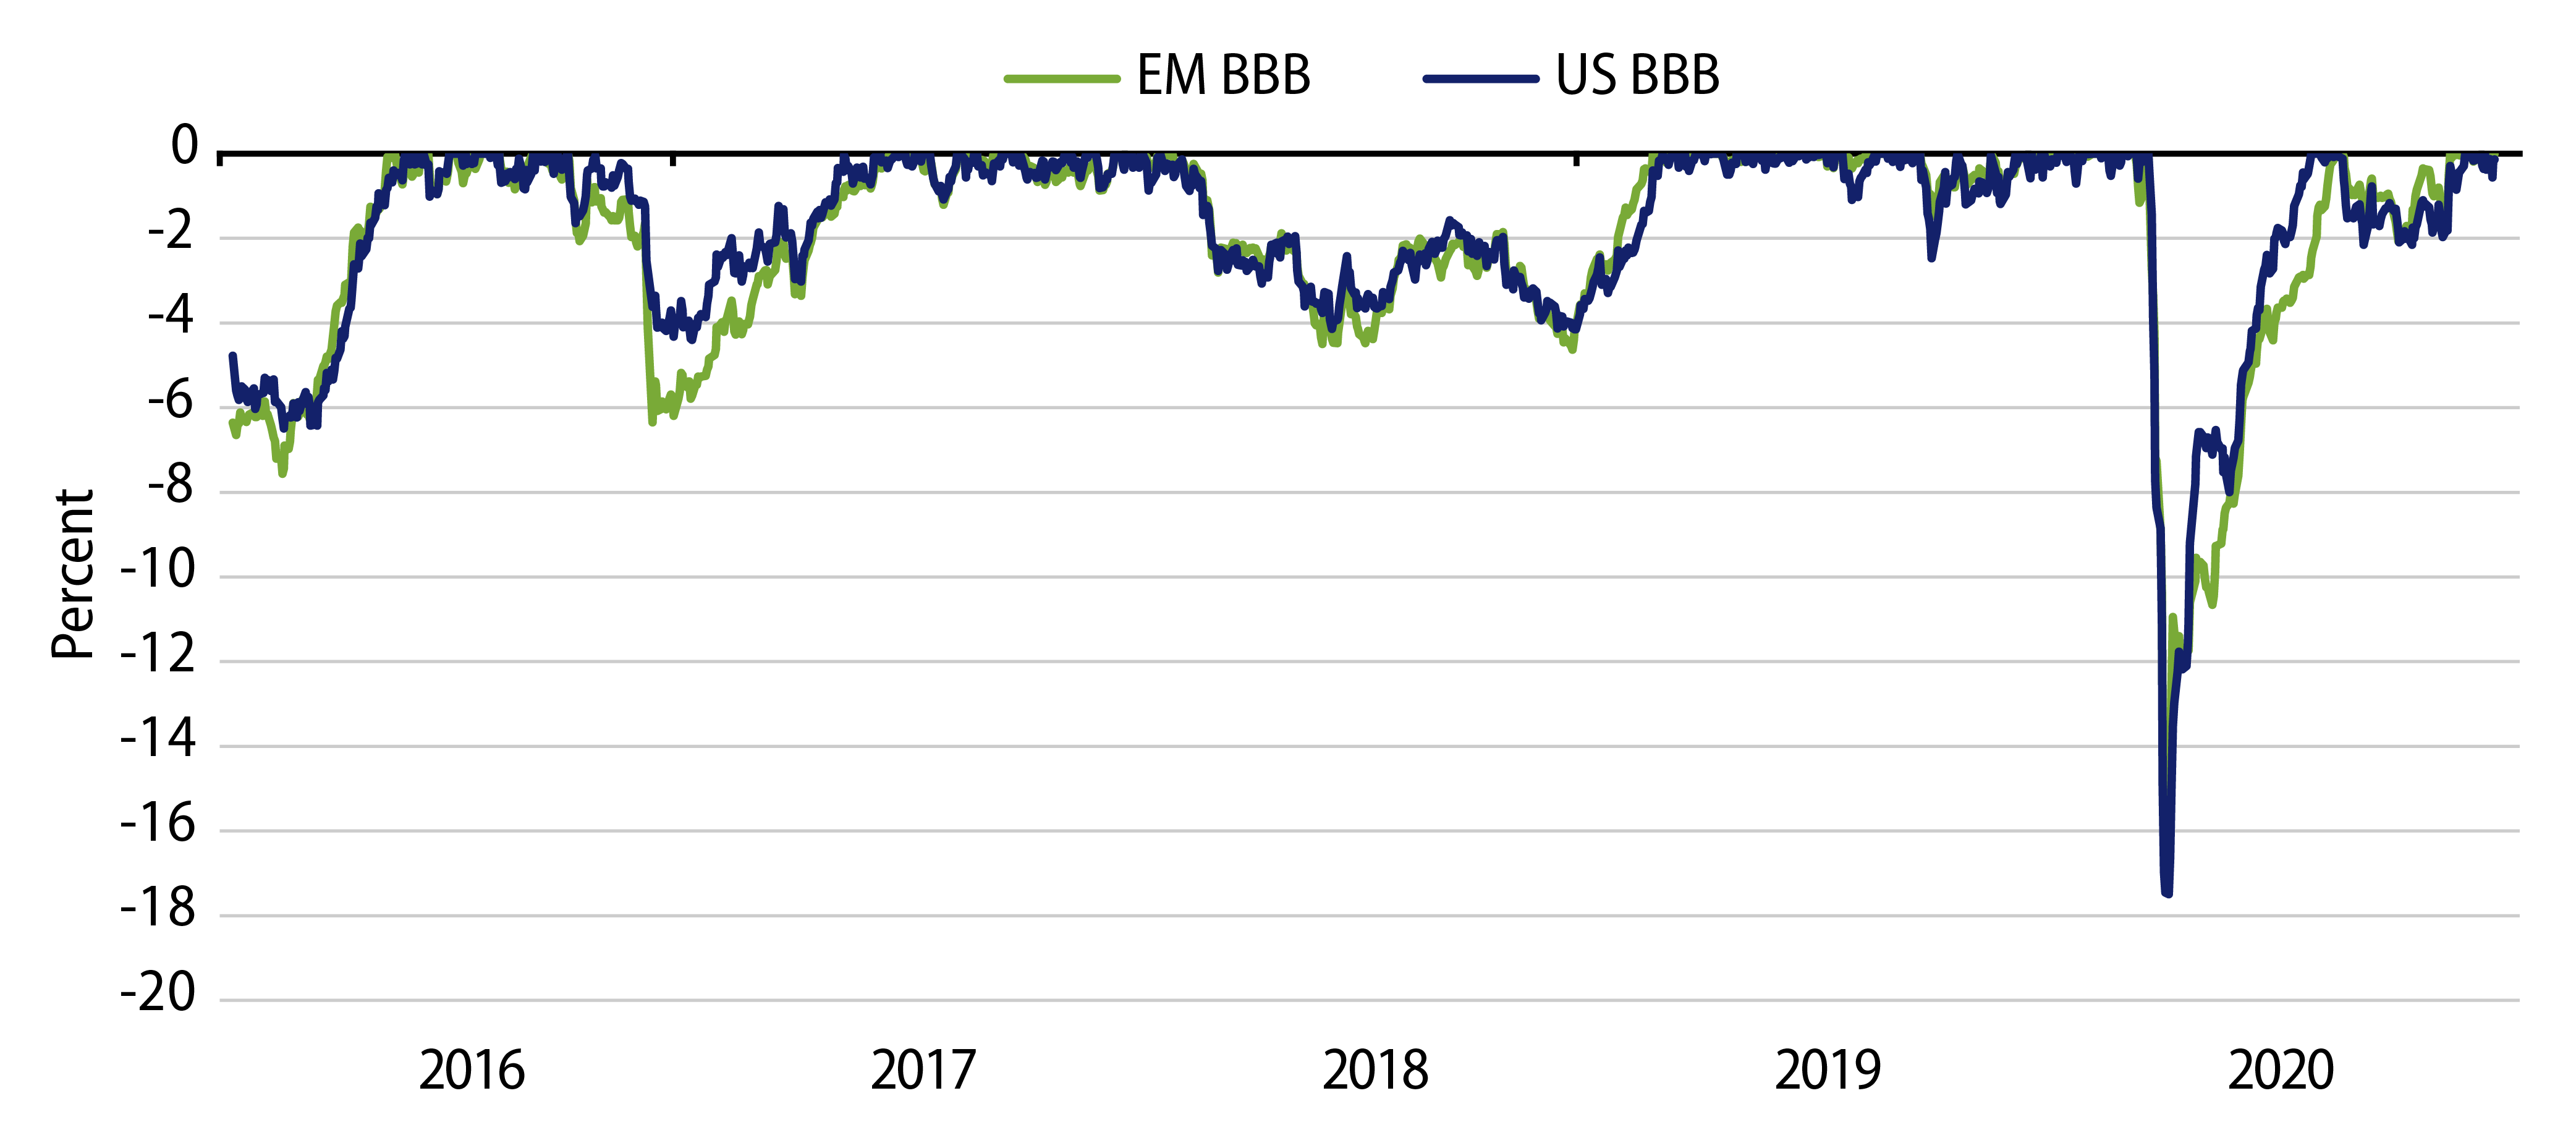
We believe this data suggests the ratings agencies do a reasonably good job of assessing credit quality between EM and DM. Given equivalent credit risk and a yield premium for EM, insurance companies can take advantage of this additional income per unit of risk, particularly when partnered with an active EM investment manager such as Western Asset. Despite there being a perception among investors that EM is a more volatile asset class, the data seems to suggest the opposite. The drawdown chart in Exhibit 3 shows that BBB rated EM debt has performed comparably to US BBBs under stressed market conditions.
The Value of EM in a Post-Pandemic World
In summary, investors are looking toward EM as a potential top performer as we enter 2021 and start to look beyond the COVID-19 pandemic. For our general account insurance clients, we believe a secular high-quality allocation to EM has considerable benefits in terms of income and risk-adjusted return in addition to an attractive entry point. Unlike an off-the-shelf solution, Western Asset’s customized approach to EM debt enables investors to home in on the value proposition without some of the extra baggage that can accompany EM exposure.