The Fed’s accommodative monetary policy has had very contrasting effects on short- and long-term rates. Money market yields continue to collapse toward zero, driven by the wall of liquidity available in the banking system, while the 10-year US Treasury (UST) yield has seen a stop-start upward pressure due to increasing inflation fears.
In this post, we highlight a number of key short-term rates and their inter-relationships, as well as how the Fed’s overall policy framework has resulted in historically low front-end levels surpassing those experienced during the last period of Zero Interest Rate Policy (ZIRP), from 2009 to 2015. To date, the Fed has explicitly stated that negative interest rates do not have a place in its current policy toolkit. Despite this, the one-month UST yield has occasionally traded negatively since mid-March 2021, while the Secured Overnight Financing Rate (SOFR), a measure of aggregate rates paid in the tri-party repo market, has recently been locked at 0.01%. Meanwhile, 3-month LIBOR, a measure of rates paid on short-term credit, is trending downward with a recent print of 0.16%, according to Bloomberg.
In light of this, and as front-end rates compress to the zero bound, we ask “how low can we go?”
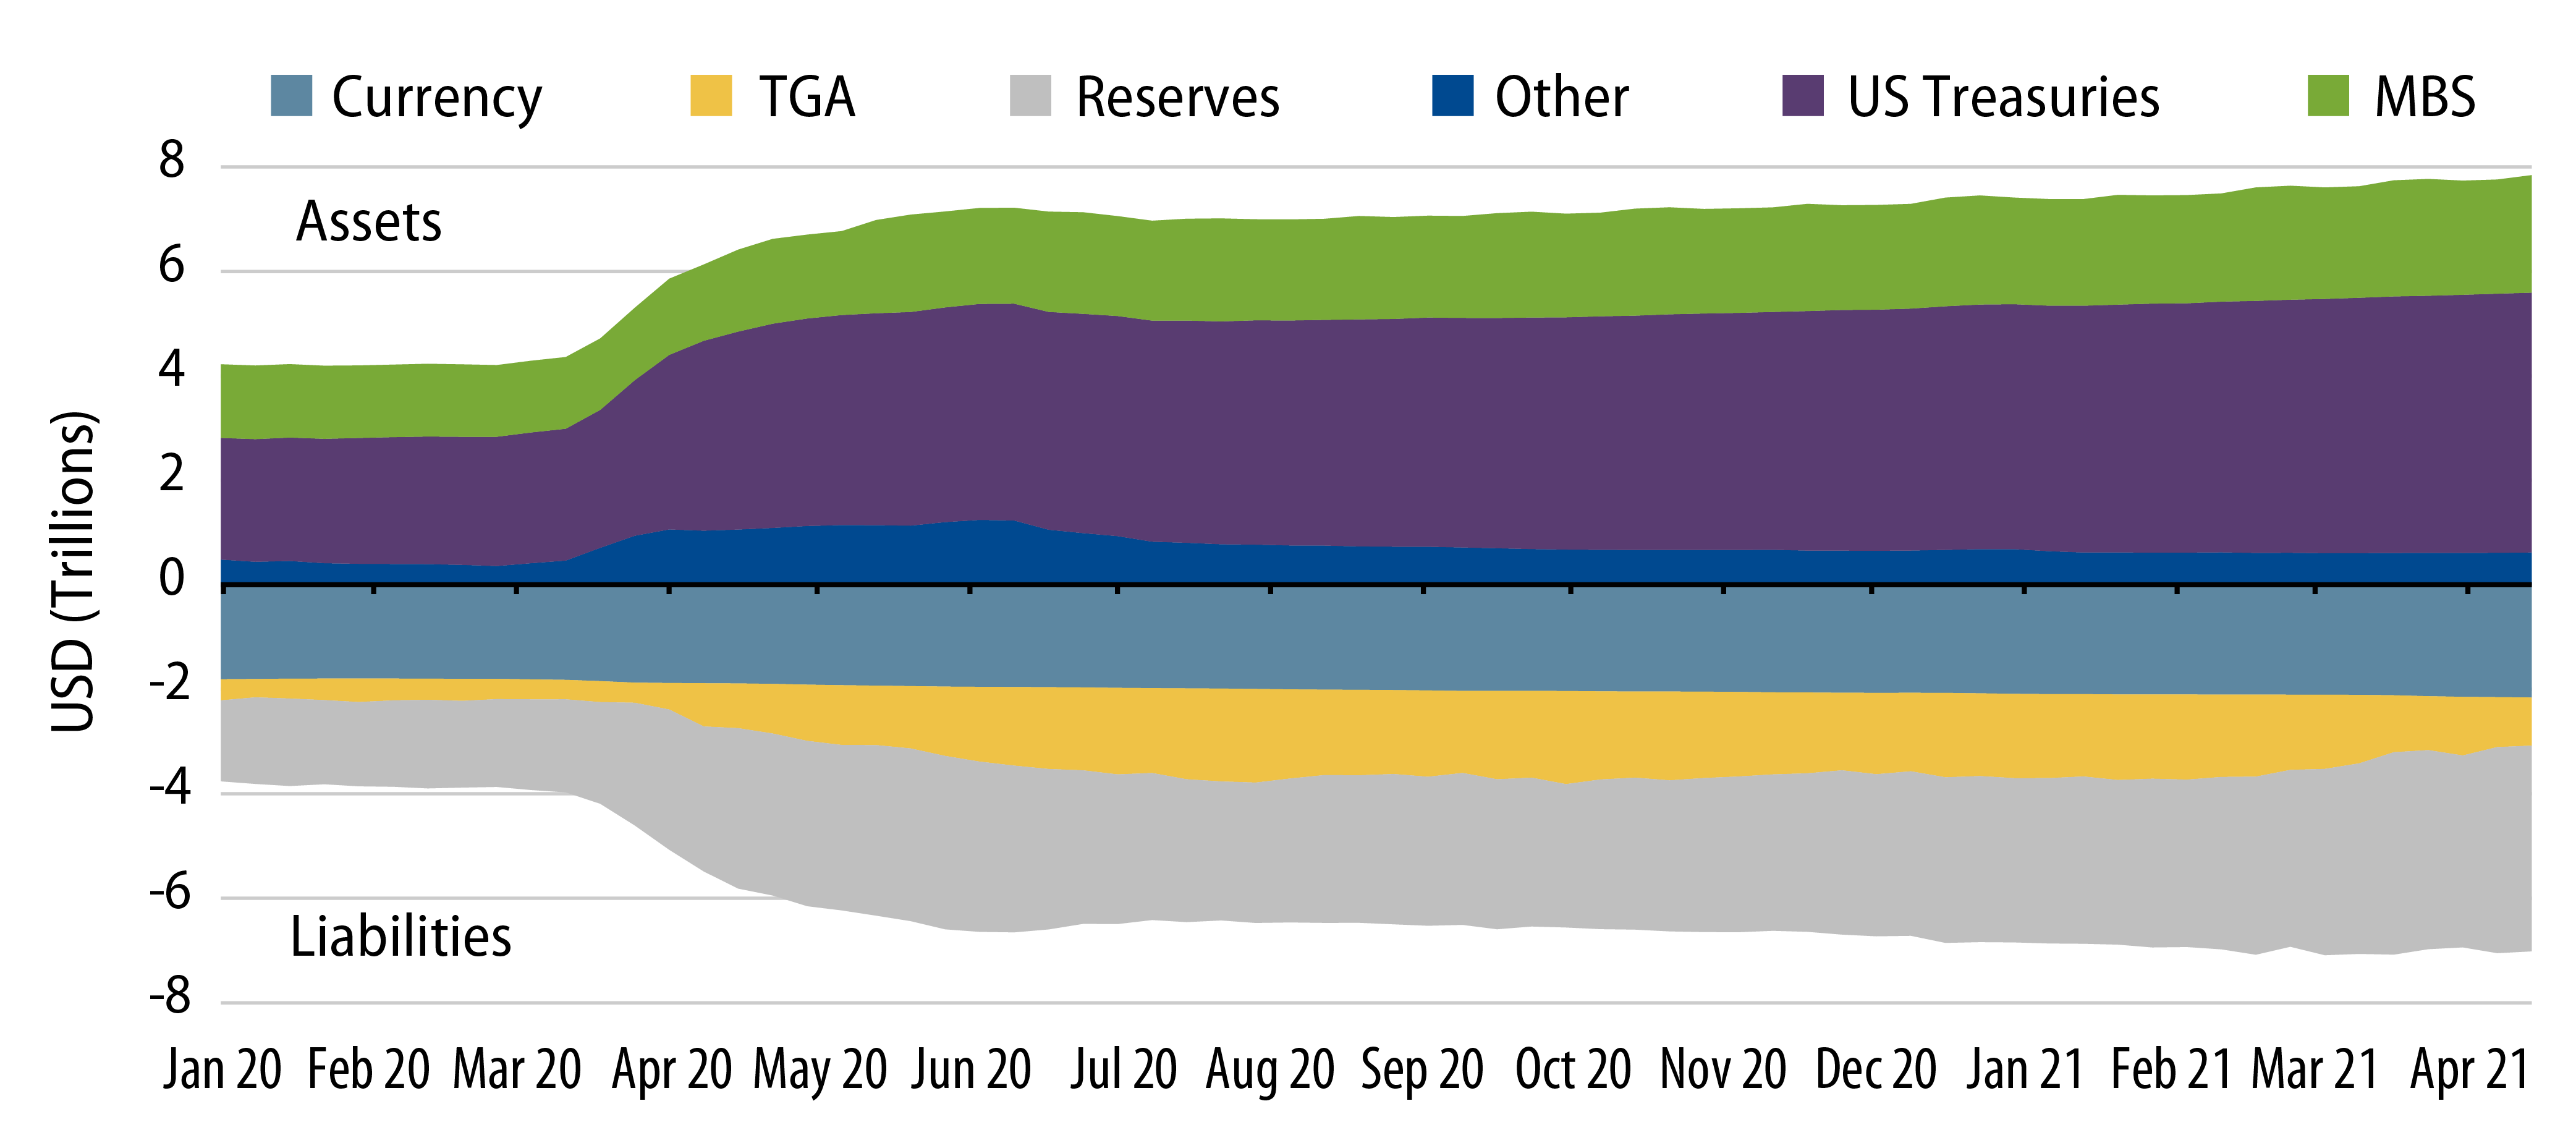
Since March 2020, the Fed’s balance sheet has markedly increased through asset purchases, with corresponding growth in its liabilities, including bank reserves and the Treasury Department’s “checking account” at the Fed, the Treasury General Account (TGA). Changes over recent months in the TGA balance, made through Treasury Department spending, have created significant increases in banking system reserves. As the TGA decreases (or increases), bank reserves increase (or decrease). With lending volumes to clients still relatively low, banks have little ability to use these reserves other than to purchase USTs, agencies and other eligible instruments as regulatory-defined High Quality Liquid Assets (HQLA), which in turn has driven down front-end rates for those sectors. Exhibit 1 reflects the growth in assets and liabilities as the Fed’s balance sheet has expanded over the past year or so.
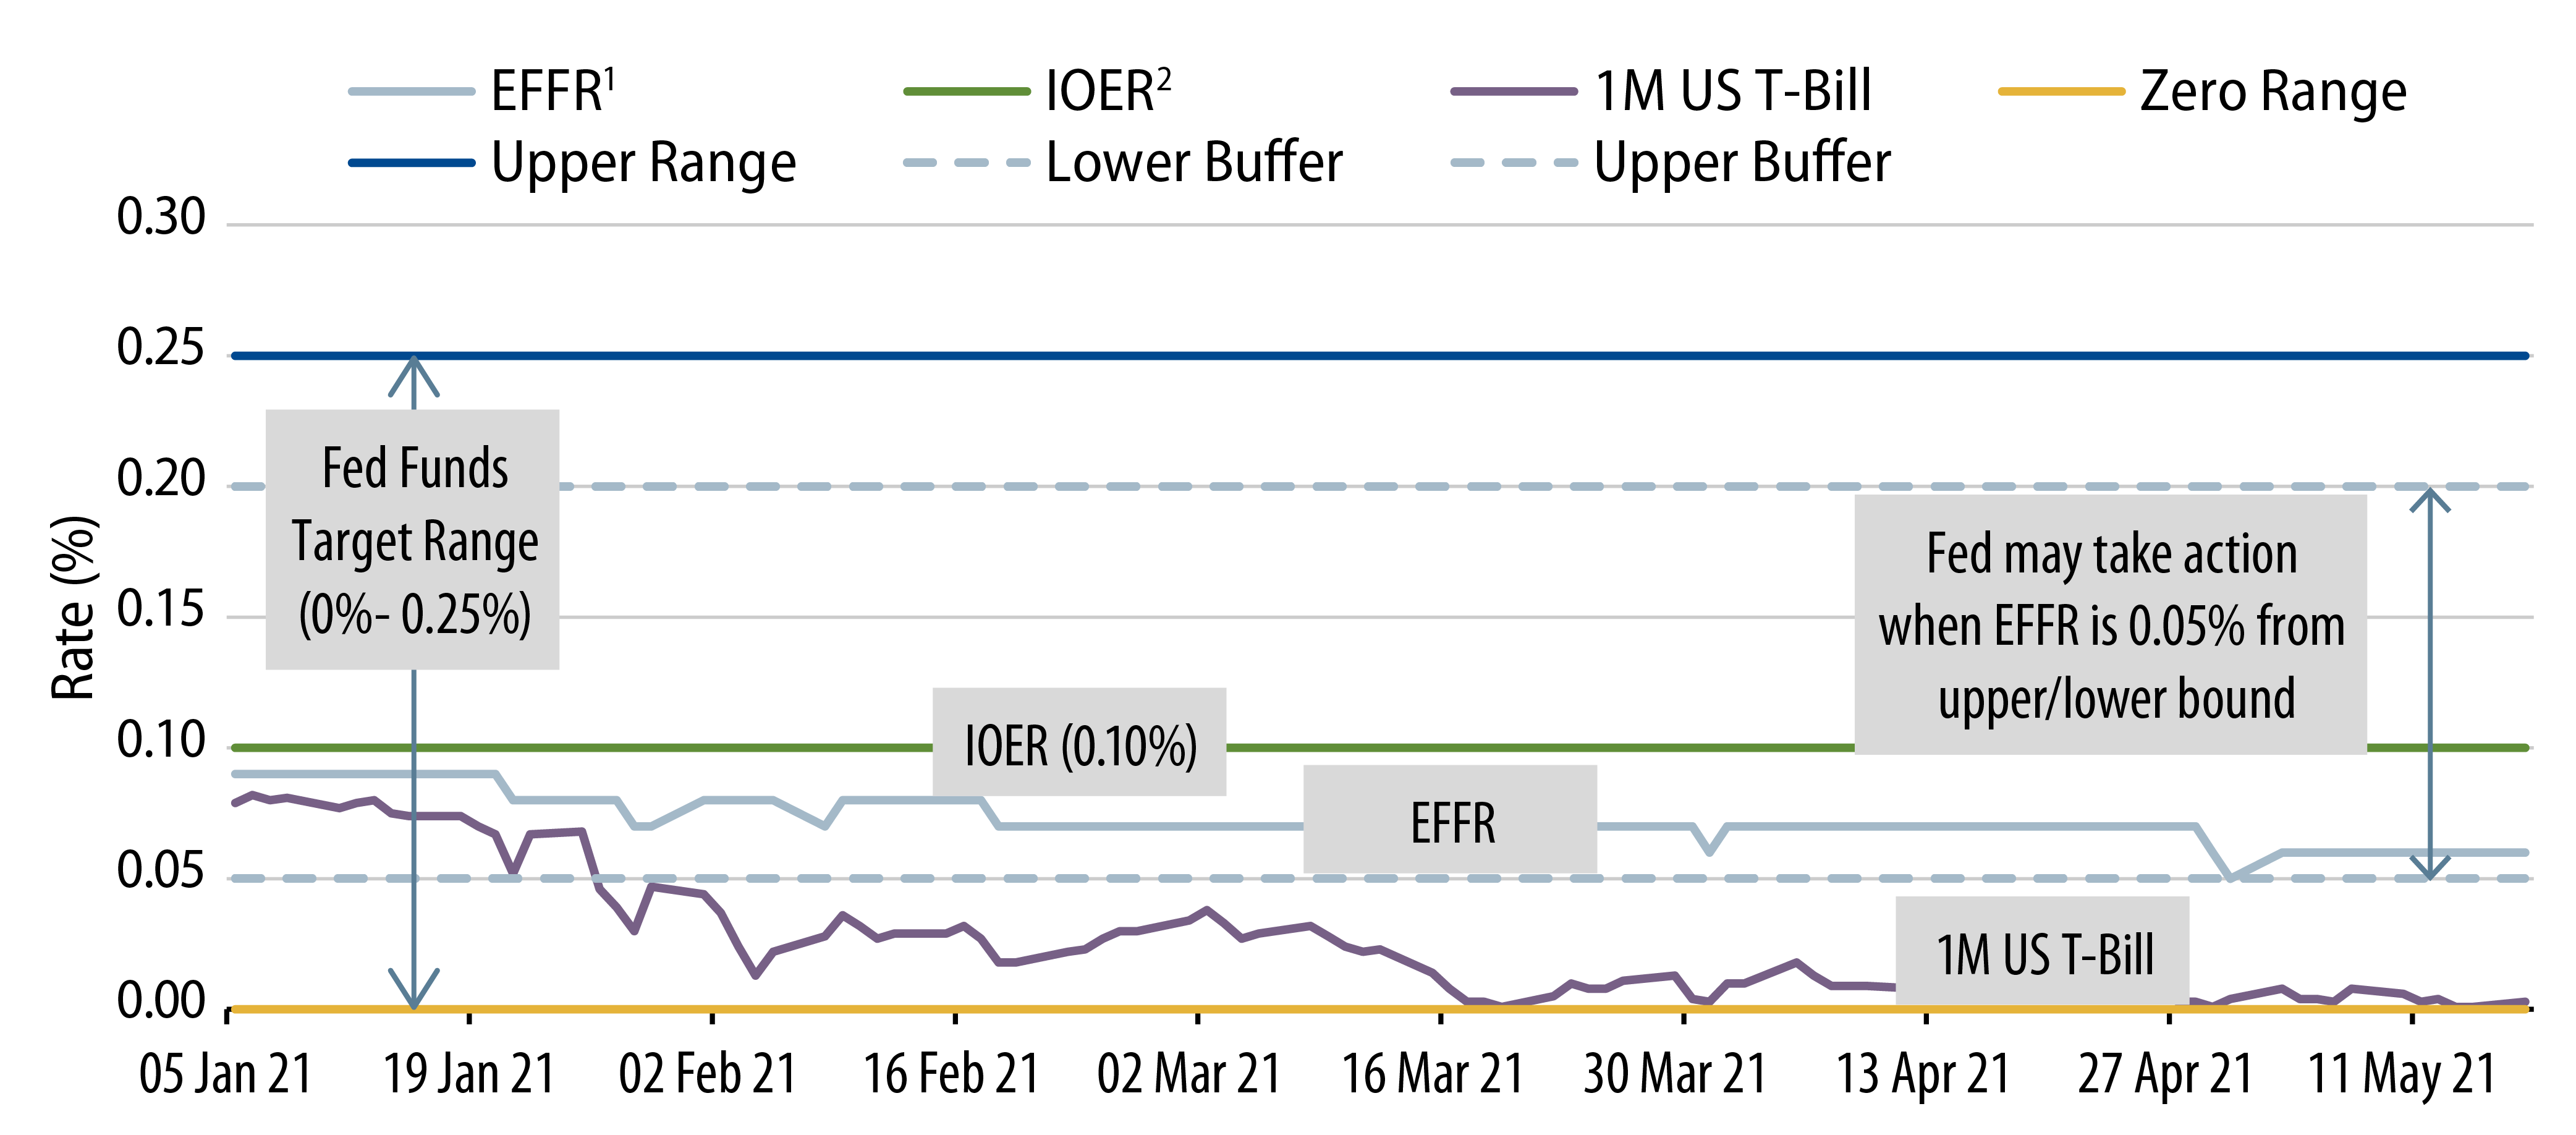
While bond purchases support the Fed’s policy targets across the yield curve, the Fed’s target range for overnight borrowing rates—the Effective Fed Funds Rate (EFFR)—is used to maintain levels of short-term rates in the economy. Since March 2020, the range has been set from 0.0% to 0.25%. Surprisingly, when contrasted with volumes in other key market rates, EFFR levels are measured through tracking volumes of around just $70 billion in domestic and foreign bank branch/agency overnight US dollar inter-bank borrowing, according to the Fed. During the last ZIRP, the Fed would consistently look for EFFR to arrive at the mid-point of the target range, or around 0.12% (i.e., mid-way between zero and 0.25%). In recent months, the Fed has allowed EFFR to trend toward the lower bound, currently printing 0.06%, according to Bloomberg. Meanwhile, the Fed is generally expected to make policy adjustments when EFFR approaches within 0.05% of the upper or lower bounds.
In addition to setting overnight borrowing levels through the fed funds market, the Fed uses two key “administered” rates to support monetary policy transmission at the front end: Interest on Excess Reserves (IOER) and the Reverse Repo Program (RRP).
In contrast to EFFR, IOER is a fixed rate that the Fed pays to banks that leave reserve balances at the Fed. Currently set at 0.10%, IOER would usually create a floor for the EFFR, paying slightly less than the overnight inter-bank rate. In recent months, EFFR has drifted well below IOER, prompting speculation that the Fed may need to alleviate downward pressure on rates by upwardly adjusting IOER and/or the rate paid on the Reverse Repo Program (RRP).
Complementing IOER, the Fed uses the RRP as a policy mechanism to absorb excess liquidity, particularly from eligible money market funds (MMFs), banks and government-sponsored entity (GSE) participants. The RRP allows approved investors to invest overnight cash with the NY Fed against repo collateralized by the Fed’s balance sheet securities. The Fed currently pays zero to RRP participants and primarily uses the facility as a release valve to absorb excess liquidity, while also reducing the incentive to buy negative-yielding securities. During “normal” market conditions, RRP balances are close to zero. In recent weeks, with nowhere to go to invest their cash, MMFs and other eligible counterparties have driven RRP balances to as high as $241 billion as of April 2021, according to the NY Fed.
The Fed continues to reinforce the RRP’s importance as a key policy mechanism by recently approving expansion of the RRP to smaller eligible participants, while also increasing the maximum amount an approved entity can invest from $30 billion to $80 billion. This allows the RRP to reinforce a floor under front-end rates while increasing the RRP’s usefulness in absorbing unwanted bank reserves.
Since the onset of the COVID-19 crisis, M2 or money in circulation in the US economy, has increased from around $16 trillion to $20 trillion, while the Fed’s balance sheet has increased from $4 trillion to $8 trillion, according to the Fed. MMFs have supported monetary transmission through funding trillions of dollars of UST purchases even as rates have continued to crunch lower, to levels where it may be difficult for MMFs to remain open to new investors while remaining commercially viable. UST securities held by US-registered MMFs are currently $2.3 trillion, from around $4.5 trillion, in industry balances, according to the Investment Company Institute. Some commentators argue that allowing front-end rates to remain at or below current levels risks negatively impacting the ability of MMFs to act as transmission mechanisms.
The Fed has publicly stated that it will not change its “administered rates,” IOER and RRP, until “undue downward pressure” has been experienced on front-end rates. This has been interpreted as five consecutive days of EFFR at 0.05%. At the time of writing, EFFR has occasionally dropped to 0.05%, but not for an extended period. Market participants expect that the Fed may increase IOER and RRP by up to 0.05%, to 0.15% and 0.05%, respectively, at the June 2021 FOMC meeting, if not before. For front-end market participants, this would provide some measure of relief, at least in the short term.