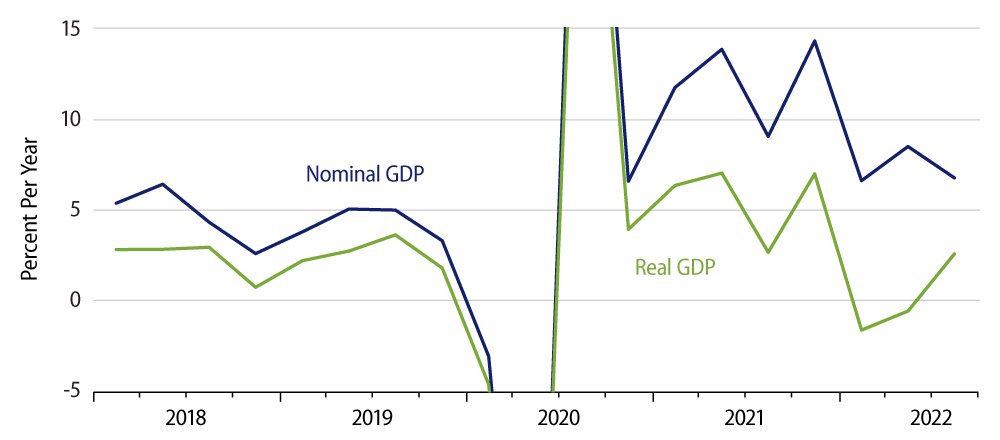
This morning, the US Bureau of Economic Analysis (BEA) released its first official estimates of GDP for 3Q22. Full data detail is not yet available as of the time of this writing, but we can summarize here what has been reported. BEA estimates that real GDP grew at an annualized rate of 2.6%, following estimated annualized rates of -1.6% and -0.6% in 1Q and 2Q, respectively. Meanwhile, the price index for GDP showed annualized inflation of 4.9% in 3Q, down from rates of 6.6% and 7.3% in the preceding quarters, respectively. All told, nominal GDP rose at a rate of 6.7%, after rates of 6.6% and 8.5% in the preceding quarters.
The stated inflation measure is a “headline” indicator, that is, including food and energy prices. (It includes prices of all items included in GDP.) If you are wondering how headline inflation could have been 4.9% when headline Consumer Price Index (CPI) numbers were zero in July and August, there are two technical reasons that explain this.
First, the stated inflation rate measures the movement from the average level for 2Q to the average level for 3Q, whereas the headline CPI was flat in July and August. When you take the change from one quarterly average to another, some of the movement that occurred late in the initial quarter—in this case, 2Q—leaks into the subsequent quarter. Thus, for headline CPI, the rate of change from 2Q to 3Q was 5.7%, whereas that from June to September was 3.3%. Similar “lagged” effects held up the GDP price index. The second technical effect has to do with oil being a net imported item now for the US, and imports affect GDP negatively, so that falling oil prices—by themselves—actually work to raise the GDP price index to some extent.
In any case, the data do indicate some decline in inflation in 3Q, and we are hopeful that more is to come in 4Q and after. One factor pointing in this direction is that nominal GDP looks to be on a decelerating trend. Sustained accelerated inflation requires a sustained acceleration in nominal GDP growth. When nominal growth is slowing, as has been the case over the last year plus, prices effectively compete with output for each more slowly spent dollar, and, eventually, prices are reined in. There are reasons to expect nominal GDP growth to continue to trend yet lower, pulling inflation down with it.
Meanwhile, the real GDP data suggest the economy did better in 3Q than in the first half of 2022. We are very skeptical of such an assertion. With respect to the components of GDP, consumer spending grew more slowly in 3Q than in the first half of 2022, and housing construction contracted much more sharply. Business fixed investment picked up only modestly. The reported improvement in GDP growth in 3Q was actually due to a big improvement in the trade deficit.
Movements in the trade deficit are mostly goods-related, and the improvement in trade—without an offset from inventories—implies a huge 3Q acceleration in goods-sector output, an acceleration that was not reflected in other indicators such as industrial production (IP) or manufacturing payrolls. Of course, the opposite was true for 1H data. The reported declines in GDP then indicated sharp declines in goods-sector output, yet IP and factory payrolls showed none of that.
Our own take is that Covid-related disruptions have taken their toll on government data collection, leading to wild—and likely inaccurate—swings in reported GDP growth. Average growth for the last four quarters is 1.8%. That is probably more indicative of actual economic performance than any of the reported growth rates for the last four quarters individually.