
Real gross domestic product (GDP) rose at a rate of 2.0% in 1Q, according to data released today by the Commerce Department. That growth rate was close to the 2.4% rate we had been expecting, as the government shutdown ended and motor vehicle output rebounded from a 4Q plunge, both as expected. There was also a much larger than expected increase in business equipment investment. However, those boosts to 1Q GDP growth were partially offset by softness in consumer spending on goods and by a sharp deterioration in the trade balance. Both these developments are curious as we will discuss in detail. On net, then, while 1Q26 growth was close to pre-4Q25 trends, it did not work to reverse soft 4Q growth.
As you will recall, the federal government shut down through October and most of November due to a budget impasse. As a result, federal spending on services within the 4Q GDP data showed a decline large enough to reduce 4Q GDP growth by a full percentage point. With the shutdown mostly over in 1Q, but for a brief, week-long second shutdown, government spending rebounded in 1Q, reversing most of the 4Q plunge. Meanwhile, the 4Q plunge in vehicle output reflected an icy reception to the 2026 model year. Dealers trimmed back inventories then. 1Q vehicle output showed a rebound there, offsetting about half of the 4Q decline.
By themselves, the bounces in government spending and vehicle output in 1Q should have driven GDP growth then north of 4%. However, again, there were partially offsetting drags on growth coming from consumer goods spending and the trade balance.
We have talked a lot about consumer goods spending in previous posts. Nominal spending on goods (merchandise) grew just as strongly in 1Q as in previous quarters. However, a bounce in goods prices turned that nominal gain into a decline in real goods spending, hence a drag on GDP. The curious element to this is that those price increases were not reflected in the Consumer Price Index (CPI). To repeat, the Personal Consumption Expenditures (PCE) price index and CPI for goods other than food and energy show vastly different rates of inflation over December-February.
So, there was no slowing in nominal spending, but a substantial slowdown after adjusting for reported inflation. In our April 13 post, we discussed the disparity in inflation data between the PCE and CPI indices, and we highlighted a number of individual items for which the two measures showed vastly different results, such as kitchenware, computers, sporting goods and periodicals. These disparities account for the reported decline in consumer goods spending over December-February. The question is which price measure is more accurate and, therefore, whether the reported 1Q goods spending decline is for real.
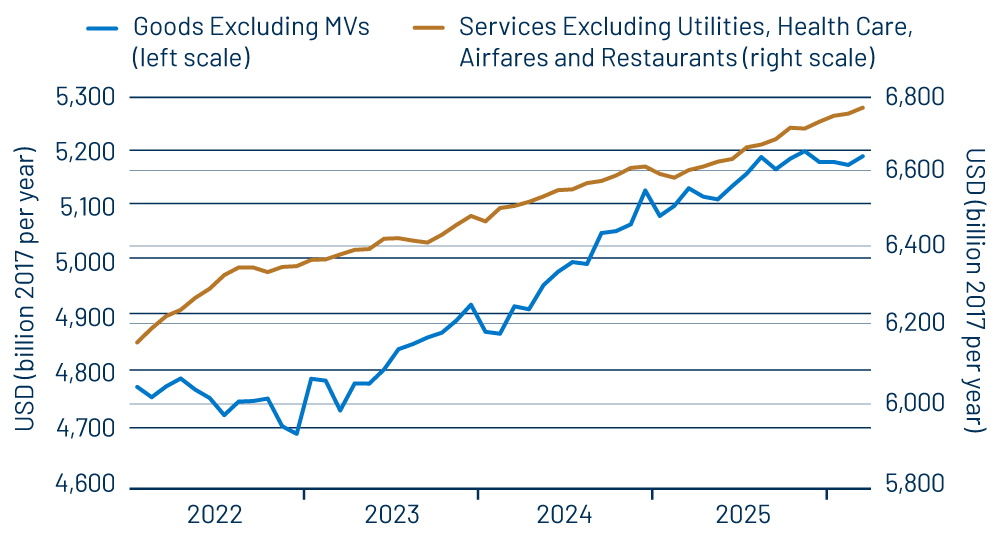
The good news is that the disparity in pricing largely disappeared in March and with that consumer goods spending was reported to have risen nicely, as you can see in Exhibit 2. That chart also shows you the continued decent growth in services spending.
Meanwhile, the other source of drag on 1Q GDP was a large deterioration in the trade deficit, which single-handedly reduced 1Q reported GDP growth by nearly 2 percentage points. The trade deficit does indeed jump around from quarter to quarter. However, the monthly trade deficit data we had seen through February did not suggest anything like the decline reported today. Either the March trade deficit will be gigantic or we have yet another source of disparity between various data sets.
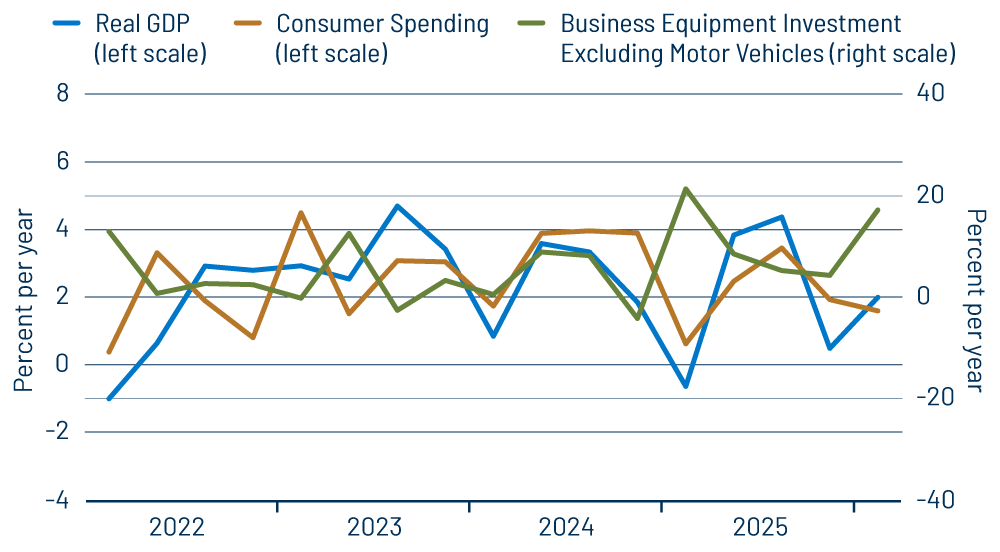
Finally, the other big story within the GDP data was another sharp increase in business equipment investment. This sector has been growing nicely for a full year, and the 1Q reported increase was the largest yet. As seen in Exhibit 1, it amounts to a 17.2% rate of increase, compared to a 1.6% rate of increase for overall consumer spending and a 2.0% rate of increase for GDP.
Going forward, the CAPEX surge looks like it will continue. For consumer spending, ongoing growth in services spending and the apparent rebound in goods spending augur well. The 1Q plunge in the trade balance is not likely to recur in 2Q. Barring disaster elsewhere or a larger effect of the Iran conflict on growth than what we currently expect, it is likely that 2Q GDP will be a good bit faster than 1Q. We would also throw out the possibility that the 1Q trade deficit number gets revised for the better, nudging reported 1Q growth upward as well.