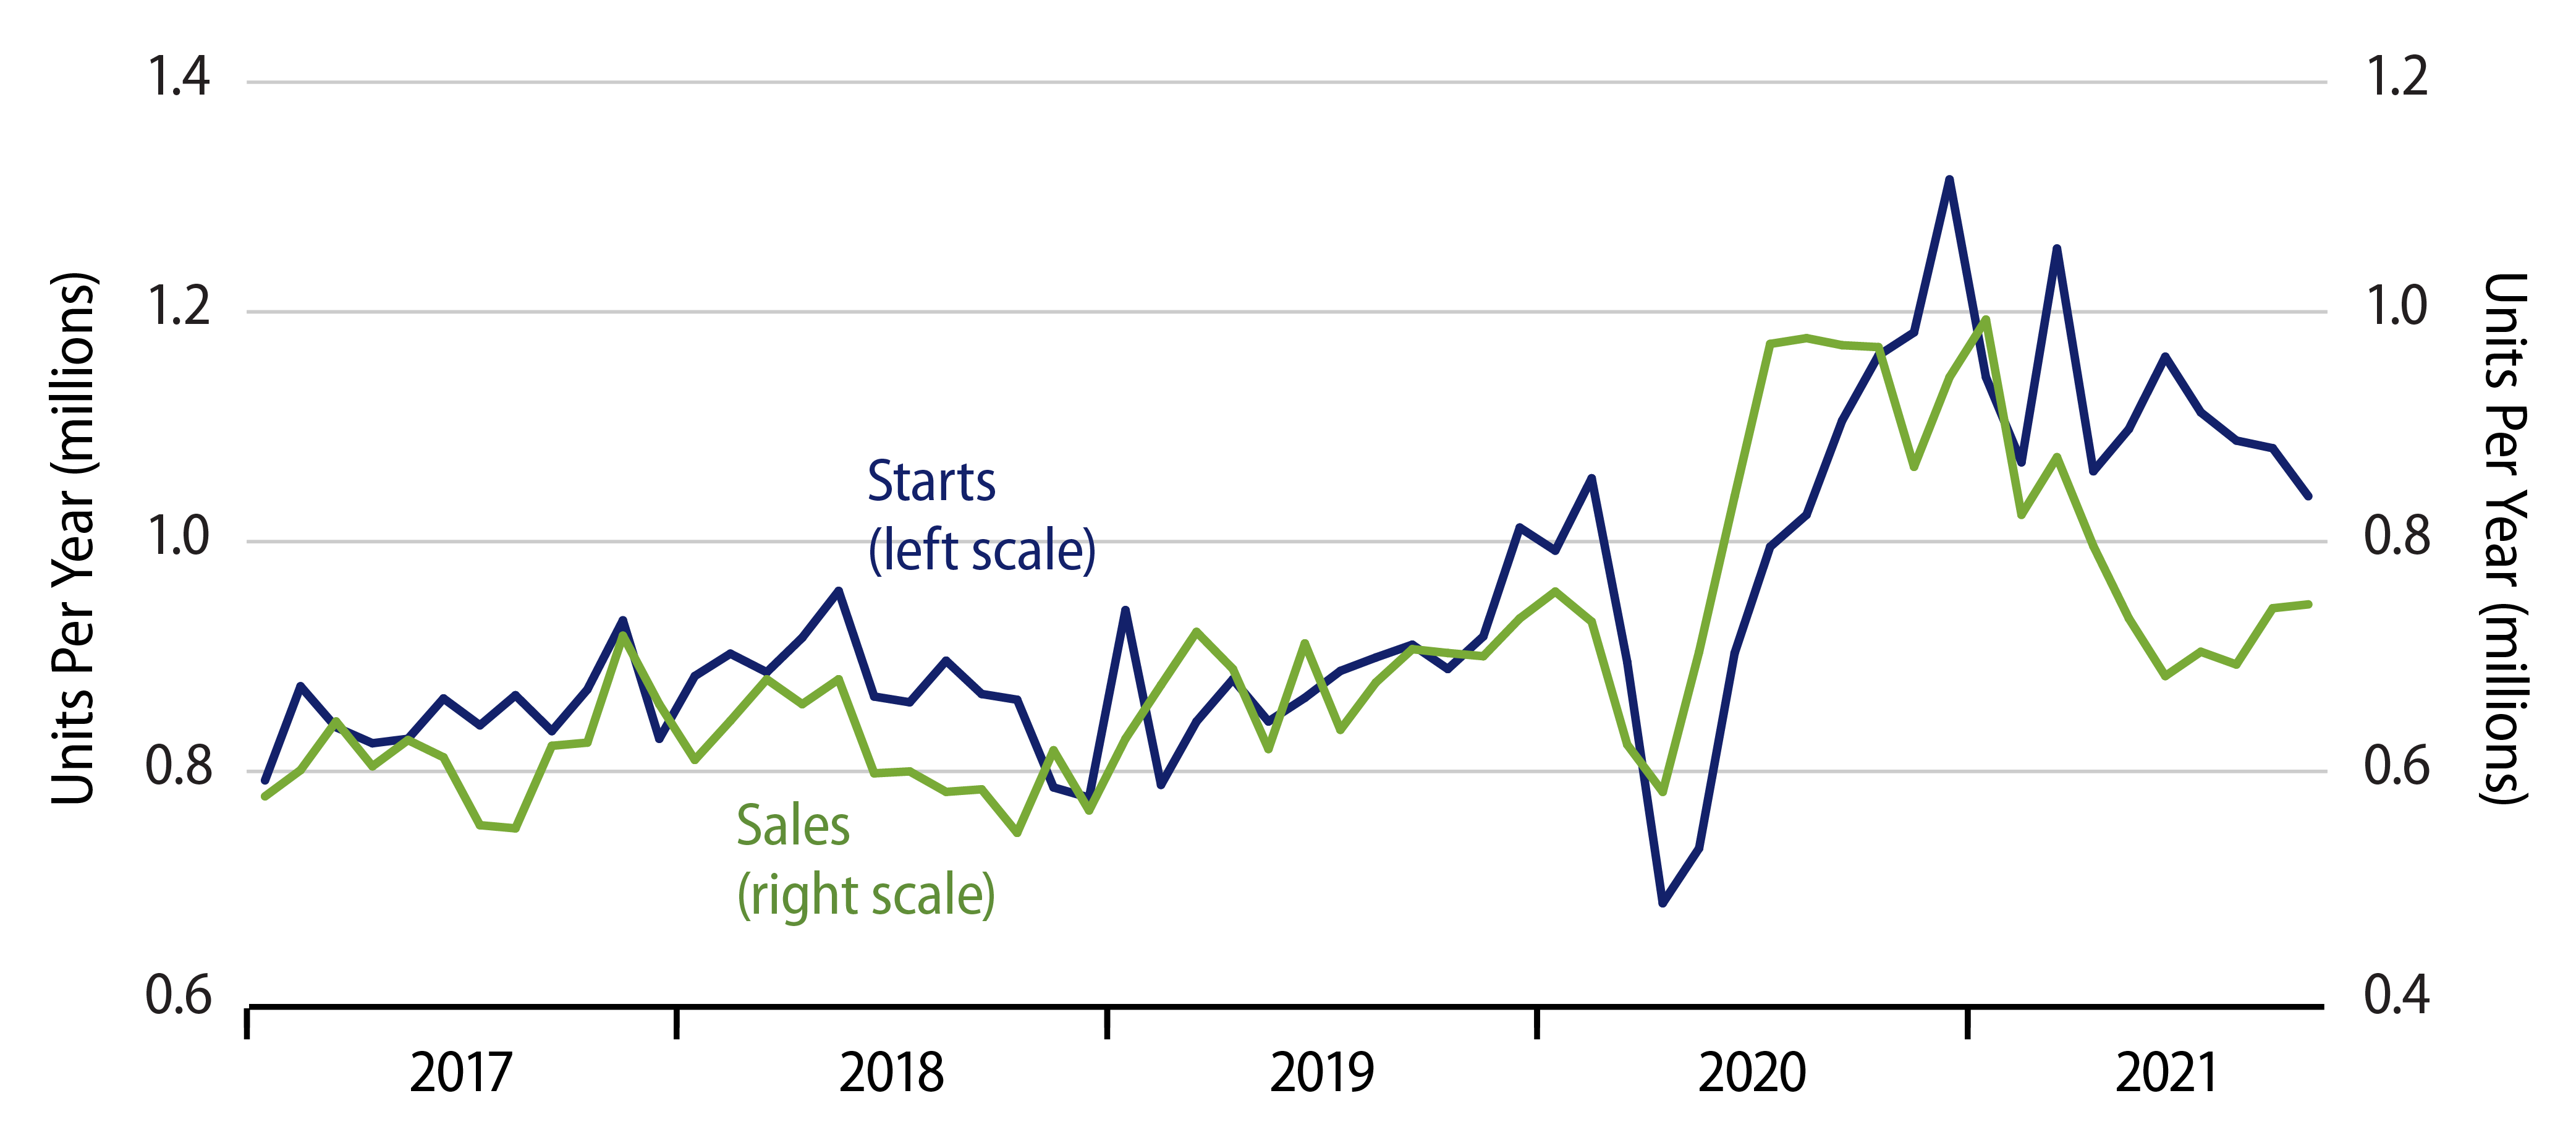
Housing industry data this month for October showed single-family starts dropping by 3.9% from September’s levels, while sales of new single-family homes eked out a small, 0.4% gain. Neither datum changed the trends for homebuilding in place since late-2020. That is, as you can see in the accompanying chart, both starts and sales of new homes have been trending substantially lower since peaking around August 2020.
Media accounts and some economists still talk about a strong housing market, and no, we would not disagree with them completely despite the recent declines. That is, even after the declines in starts and sales over the last 14 months, both remain at levels somewhat elevated from what we were seeing prior to the onset of the pandemic.
In other words, in terms of the (absolute) level of activity, the housing market is still “strong.” However, it has been in a mild decline for more than a year, and so it has been a drag on economic growth for quite some time now.
This highlights a distinction in economic analysis—indeed, in any analysis—between “high” and “rising.” We see this all the time when discussing inflation. Non-economists think of “inflation” as meaning prices are high. Economists, however, think of inflation as a constant rising in prices, essentially all prices. High prices—for some commodities—do not push interest rates higher. An unceasing rise in essentially all prices does put upward pressures on interest rates.
In much the same way, high levels of housing activity can put upward pressure on home prices, certainly so if “high” home construction is still lower than the rate of household formation, but it is rising levels of housing activity that contribute to economic growth. Again, homebuilding has not been a source of impetus to GDP growth for quite a while (ever since housing starts had declined enough to reduce overall levels of residential construction spending).
At this point, it is unlikely that homebuilding levels will decline further enough to constitute a “weak” housing market. Rather, we would look for starts to continue to decline until they have re-attained pre-Covid levels. Whether activity wanes enough to start putting downward pressure on home prices depends on builders.
As you can see in the chart, new-home sales have so far dropped more sharply than starts. (The scales in the chart are shown relative to each other so as to adjust for the effects of owner-builds, that show up in starts but not in sales.) And, indeed, inventories of unsold new homes have been rising throughout the last year, so much so that inventories have constituted more than six months’ worth of sales since June, the highest relative level since 1995.
Unless starts pull back even more sharply in the next few months, inventories will continue to rise. That would eventually start to impact prices. There is no sign of that as yet. However, we believe homebuilding activity will continue to be a drag on GDP growth for quite a while yet.
We will take this chance to wish all our readers and clients a most Happy Thanksgiving.