Single-family housing starts declined -9.0% in April. However, that decline followed a 10.7% increase in March and left April single-family starts at about the same level as in February. As you can see in Exhibit 1, single-family starts have been generally flat for the last year, with the March jump possibly a reverse-echo of a sharp decline in September.
As of last September, homebuilding activity looked to be in a steady but non-calamitous decline. We had been expecting that decline to continue in order to get inventories of unsold new homes back to manageable levels. Instead, again, 1-family starts have stabilized since then.
The scales in Exhibit 1 are constructed to reflect over- or under-building, with inventories of unsold new homes rising when the blue line is above the red line and vice versa. The left scale is 200,000 units per year above that for the right, because that is the approximate amount of owner-builds per year. (Owner-builds are in starts but not in new-home sales.)
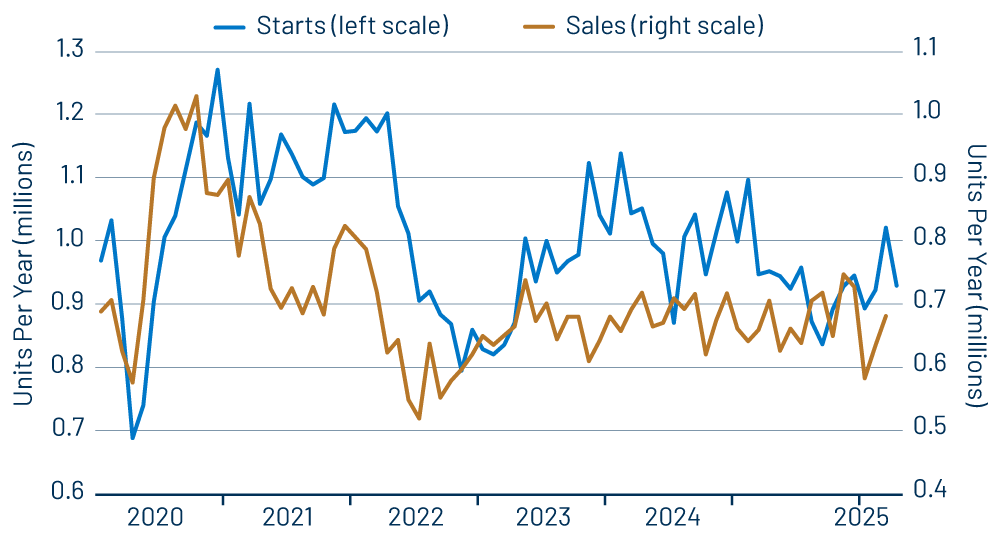
Indeed, inventories of unsold new homes were rising sharply in 2021-2022 and again in 2023-2024. However, new-home inventories have stabilized in the last few months, even though the blue line is well above the red line in the chart. Apparently, the level of owner-builds has declined recently.
Still, new-home inventories remain historically very high, holding at around 8.5 months’ worth of sales, compared to historical norms of around 4 months’ sales. Homebuilders appear to have adapted to that much higher level of inventories, as, again, the sharp further declines in starts that we had been expecting have failed to materialize.
Some analysts claim that the very high level of new-home inventories is not a problem for builders, because most of the unsold homes are either not started or still under construction. We think there are problems with this assertion. Exhibit 2 shows inventories relative to sales for the three categories of new homes: not-started, under-construction and completed. Note that inventories of completed homes are measured on the right scale, with not-started and under-construction on the left.
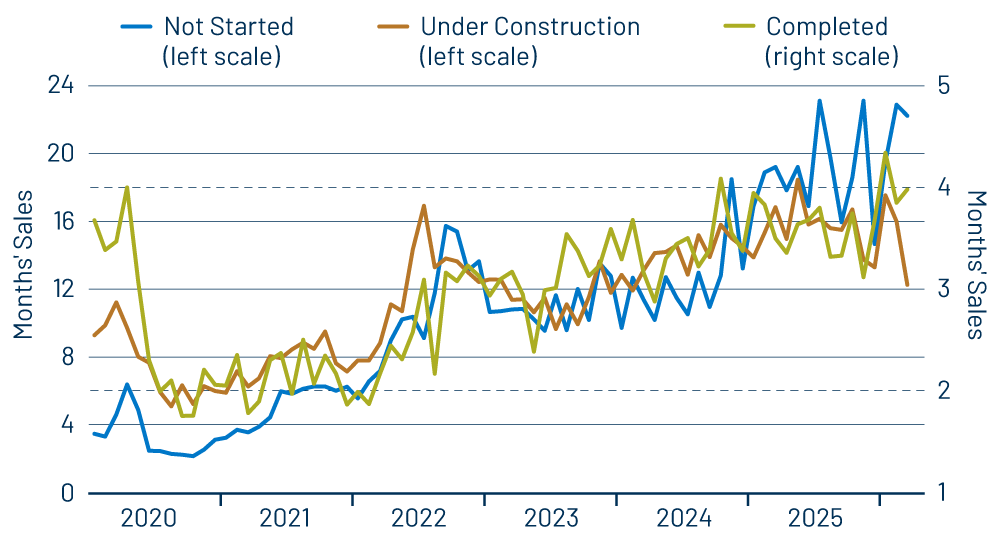
As you can see there, yes, inventories of unsold completed homes are “only” about four months’ worth of sales. However, that compares to normal levels of one to two months’ sales. Meanwhile, it is currently taking 12 to 24 months for under-construction and not-started homes either to be sold or to transition to the next stage. All these rates are way above normal levels. Yes, completed homes burden builders with the highest carrying costs, but even not-started and under-construction homes entail sunk costs of design, neighborhood development (sewers, power lines, paving), and other overhead.
Well, our protestations on this score have been to no avail as yet. Despite very high inventory levels at all stages of the building process, builders continue to start new homes at a rate high enough to forestall any decline in inventories and also forestall further negative effects on GDP growth.
Homebuilding and construction in general are the softest components of the US economy. As reported previously, manufacturing growth has picked up in the last year, and service-sector growth is at least holding at decent rates. Still, even the laggard homebuilding sector is stable, at least for now, and construction jobs continue to grow.