
The recent surge in national home prices has some market participants questioning the possible formation of a housing bubble in residential real estate. Home price appreciation (HPA) posted a year-over-year (YoY) gain of 10.4% in December 2020, up 3.4 percentage points from the September print of 7.0%. In addition, the median price of homes sold in the US is up 14.1% YoY, climbing closer and closer to the 16% gain seen in September 2005 prior to the housing crash. Fueling the housing boom of the post-Covid world are historically low mortgage rates, a dismal lack of supply on the market, tight lending conditions and a rebirth of household formations. All of this is leading us to believe that US home prices are on strong footing and far from a bubble.
From the beginning of 2013 through the end of 2019, 30-year mortgage rates averaged 4%. For roughly the same period of time leading up to the global financial crisis (GFC), which started in 2007, 30-year mortgage rates averaged north of 6%. As of December 2020, the Freddie Mac 30-year mortgage rate was 2.6% and has been below 3% since the summer of 2020. Historically low borrowing rates fuel the demand for housing. Couple that with the aging of the millennial cohort, and it’s hard to imagine enough housing for those who want it. The economic expansion seen over the past number of years had finally given millennials the ability to start forming their own households and move out of their parents’ basements. While statistics show that every age group in America is forming households at lower rates than before the GFC, the trend had begun to level off prior to the Covid pandemic. But, even at the lower headship rates seen today, it is estimated that by 2025 there will be 6.4 million more households looking for houses with not enough to go around. (Headship is the ratio of the number of households to the number of adults in the US population.)
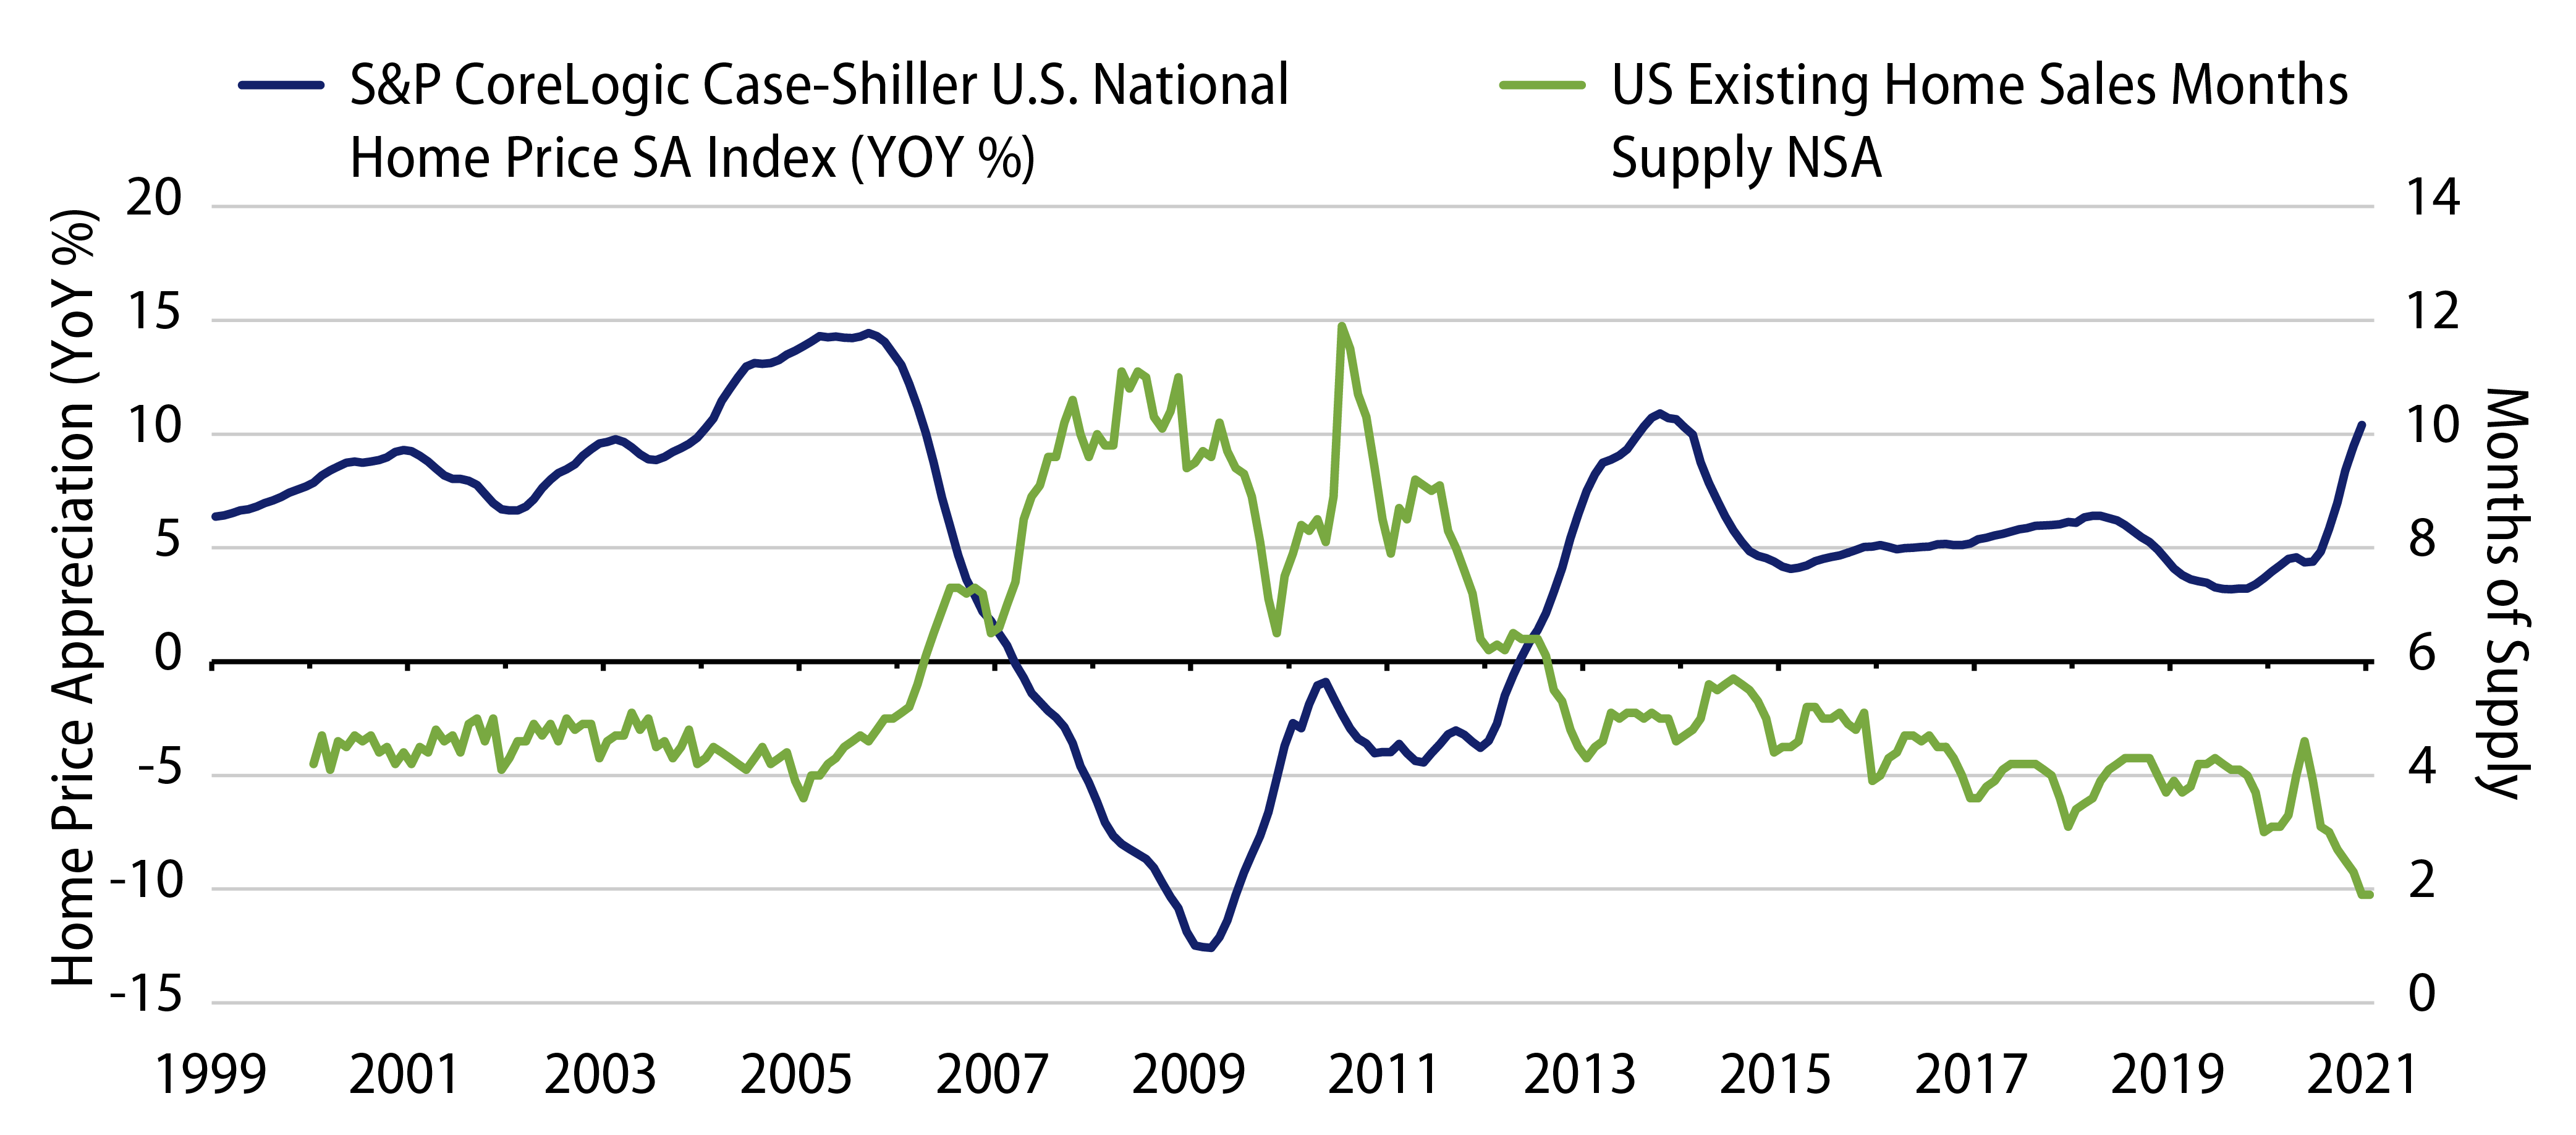
In addition to low mortgage rates and an aging population, a lack of housing inventory has created a supply dynamic fueling the price growth. A common measure used to show the amount of housing inventory on the market is current months of supply. In the period leading up to the GFC, months of supply averaged 4.5. It is widely held that a healthy amount of supply for the market is 6 months; the months of supply reported in December 2020 was 1.9 and has been under 3 since the summer of 2020. The cause of such low supply has been years and years of underbuilding amid growing housing demand. Data also shows that in the years leading up to the GFC there was more home construction than there was demand for it—now we have the exact opposite. While housing starts have been up every month since May 2020, after decades of underbuilding there just isn’t enough new housing to fill the demand, especially in a post-Covid work-from-home environment. While we continue to see new-home sales pick up and expect them to remain elevated in the near future, it is hard to see the housing stock being filled any time soon.
While a healthy balance of supply and demand provides an explanation for growing home prices, investors still question the stability of mortgage credit given today’s elevated home prices. While low mortgage rates entice many households to seek cheap financing, lenders currently are requiring much more from borrowers than they had in the past. Due to lending standards such as qualified mortgages (QM) and ability to repay (ATR), the mortgage products seen during the go-go days of subprime lending are virtually extinct. Deemed “affordability products,” mortgages allowing for various features such as option payments, negative amortization and little to no money down are no longer being created. The mortgages originated today comprise primarily 30- and 15-year fixed-rate notes. Less than 10% of total originations are adjustable-rate mortgages (ARMs), which have fixed-rate periods at the start of the loan (typically 5 or 7 years) and then reset periodically based on an index for the remainder of the term. Fixed-rate mortgages alone do not provide a guarantee against the probability of default; however, various index measures have been created to better estimate broad mortgage default risk. The Urban Institute, which provides quantitative and qualitative data on economic trends, reports that the default risk taken by the mortgage market is currently at its lowest level since 1998 for both borrowers and mortgage products. In addition, The Mortgage Credit Availability Index, an index using such metrics as credit-score, loan type and the loan-to-value ratio, shows an index reading of 124; the index peaked in late 2006 with a reported level closer to 900.
Despite a sharp increase in national HPA in previous months, a number of indicators point to strong footing for the mortgage market, rather than a price bubble. A lack of housing supply, historically low interest rates, tight lending standards and a growing population in search of housing all contribute to strong support for home prices.