
Single-family housing starts declined -6.9% in October, although that drop was partly offset by a +1.5% revision to the September estimate. Most of those declines occurred in the South, where single-family starts dropped -10.2% following a very slight downward revision to the region’s September estimate.
The South accounts for 60% of US construction activity in single-family homes, so the October decline there should be meaningful. However, there are two mitigating factors. First, October declines in both the nationwide and Southern measures partially offset sizable increases over the two preceding months. Second, throughout this month’s post, we have been talking about possible hurricane effects on the various indicators, and with the South squarely in the path of Hurricane Milton, it is obviously possible that the October decline in starts was storm-related.
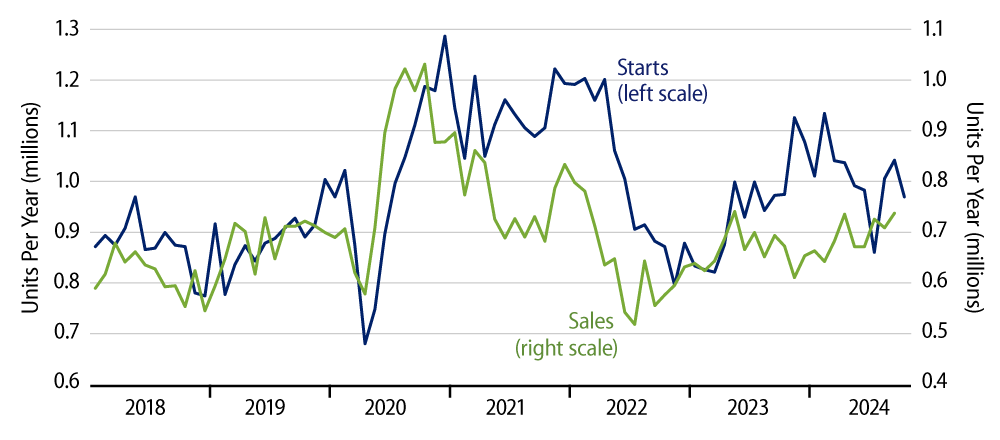
Exhibit 1 compares nationwide data for single-family starts and new-home sales. The left and right scales are adjusted for the fact that owner-builds show up in starts, but not in sales. The import of the chart is that whenever the blue line lies above the green line, inventories of unsold new homes are rising, and vice versa.
After a post-Covid-shutdown surge in home demand, sales dropped dramatically in 2021 and 2022, but starts were slower to recede, resulting in a sharp increase then in inventories of unsold new homes. New-home demand partially rebounded in 2023 and into this year, but starts increased even more, adding further to inventories.
Our take has been that the new-home market is overbuilt and that further, sharp declines in single-family home construction are in store. As yet, this has not happened. Then again, other analysts have been looking for continued gains in single-family starts, citing supposedly strong underlying demand. This has not yet happened.
In other words, the actual single-family home data have been right in the middle, contradicting forecasts on either side. So, the issue of whether the October declines are for real or are merely a storm-related construct is critical to the housing outlook. Unfortunately, as with the other indicators this month, a clear answer to that question must await further data.
We could add that housing bulls not long ago were confident that slightly lower mortgage interest rates would boost home demand. As mortgage rates rose sharply in the last month, that expectation would seem to be dashed … but the housing bulls are adamant.
Meanwhile, the multi-family market is clearly in freefall. Multi-family starts have declined -40% over the last two years. However, because of the long gestation period for multi-family projects, the rate at which units are being completed continues to rise, at least so far. Declines in multi-family starts are helping depress overall construction activity, even as the rising number of multi-family completions is increasing the available supply of rental housing.
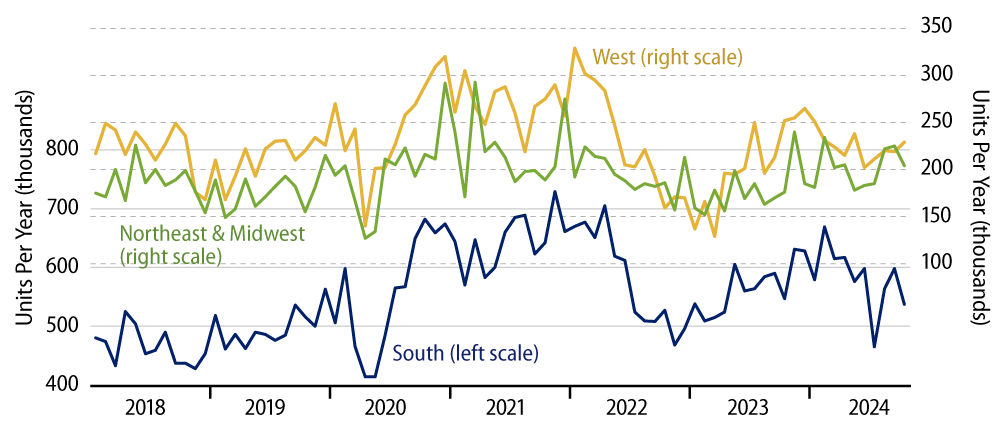
Finally, Exhibit 2 breaks down single-family starts by region. The Northeast and Midwest are combined to create a ''super-region'' that constructs almost as many single-family homes as does the West. Meanwhile, each of these are less than half the size of single-family construction in the South.
Both the regional and nationwide data tell the same story. New-home construction is hovering at rates substantially higher than what we saw pre-Covid, even though new-home sales are only about equal to pre-Covid rates and even though new homes are much less affordable now than they were pre-Covid. Again, we think this is a formula for further contraction in new-home construction, but that has not yet proven to be the case.