
Sales of new homes rose +10.6% in July, on top of a +8.3% revision to the June sales figure. Meanwhile, in a companion report released last week, single-family housing starts were reported as declining -8.6%. Rising sales and falling starts. What gives?
Well, these contrasting swings may be the beginning of a long-awaited (by us) move by builders to cut excessive inventories of unsold new homes. Yes, the received wisdom is that homes are in short supply in today’s market. This position is wholly driven by the fact that inventories of existing homes have been relatively low (although they have recently risen back to and slightly above normal levels).
However, our take is that existing-home inventories reflect both homes available to buy and current homeowners available to buy somewhere else. In other words, existing-home inventories reflect not excess supply and demand but the turnover rate of existing housing stock.
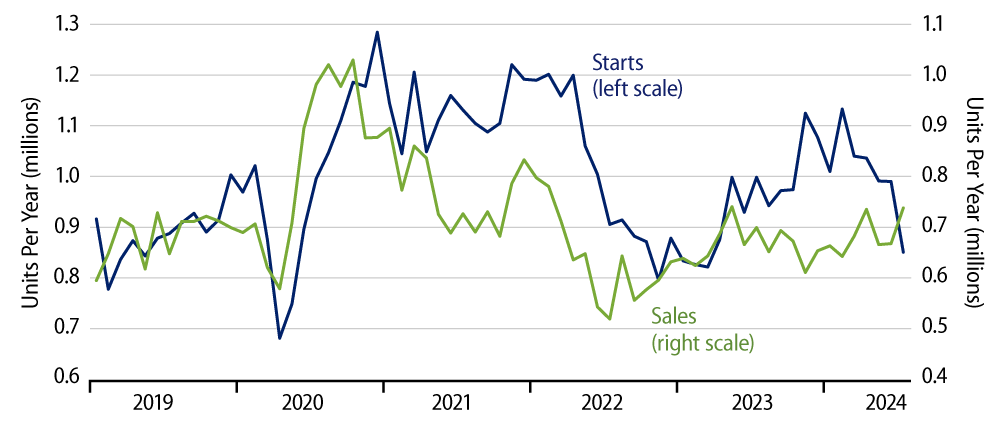
In contrast, new-home inventories reflect the ability—or inability—of housing demand to absorb the supply of new homes coming onto the market, and builders have been building new homes faster than they can sell them for the last four years (as shown in the chart). Early this year, the available supply of new homes was equal to more than 8 months’ worth of sales, compared to ''normal'' inventory levels of about 5 months’ sales.
After a 2023 construction surge failed to drive any increase in demand for new homes, builders began to cut back on housing starts in March 2024 and after. The sharp plunge reported for July in single-family starts is likely an overstatement of that downtrend, but the downtrend itself over the last five months is clear. This will weigh down construction spending and GDP growth in the second half of 2024.
In contrast, the July jump in new-home sales is NOT a continuation of any meaningful uptrend. Maybe, the July sales gain reflects slightly lower mortgage interest rates enticing some buyers. In our view, it is more likely that the July sales gain is a random blip. This contention is supported by the fact that the vast majority of the July sales gain occurred in one region, the West. In contrast, the South accounts for almost 60% of all new-home construction in the US, and while single-family home starts did drop sharply in the South in July—down -22.9%—new-home sales there barely budged, rising only +2.9%, after a -10.0% drop in 2Q24.
So, we believe the ongoing downtrend in single-family home starts is a more reliable indication than the one-month bounce in new-home sales, though the July swings for both indicators are likely overstated. Our rendering in the chart suggests that July swings in starts and sales were sufficient to begin to pare new-home inventories, and, indeed, new-home inventories did show a decline: the first meaningful drop in a year.
We believe new-home inventories need to be cut substantially further, and even if new-home sales can sustain their July levels, single-family home starts and residential construction spending will likely have to drop substantially further to sufficiently reduce inventories. As always, it will be interesting to see how starts and sales data progress in August, and this issue will be especially important for the economy’s growth prospects going forward.