Headline CPI inflation proceeded at a 2.0% seasonally adjusted annualized rate in July, following rates of 0.6%, 4.5%, 1.5% and 2.2% over March-June. Excluding food and energy, core CPI rose at a 1.9% annualized rate, following rates of 4.7%, 5.0%, 5.4% and 1.9% over March-June.
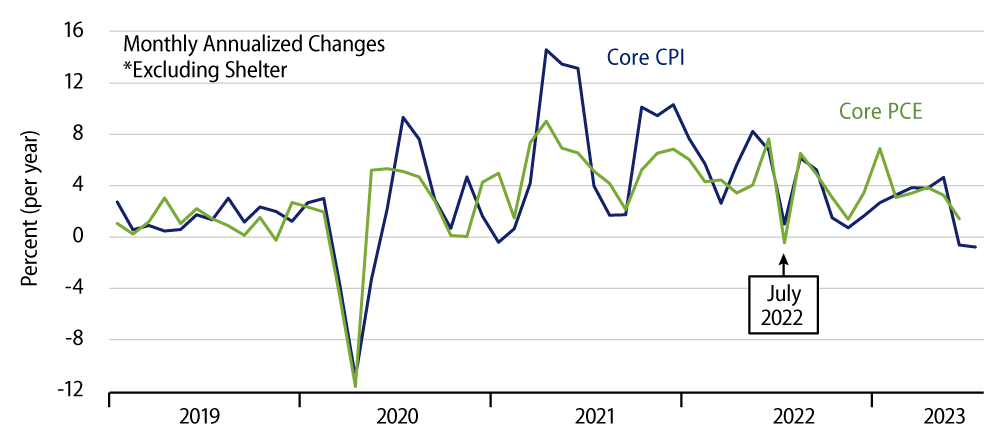
It is well known—and routinely acknowledged by Fed Chair Powell—that both the headline and core inflation rates are being held up by shelter cost estimates that reflect what real estate markets were doing months ago, NOT presently. The chart shows core inflation excluding rent of shelter. This measure came in negative in July for the second straight month.
Again, even including likely obsolete shelter data in the inflation calculation, both the core and headline measures have come in right at the Fed’s targets for two months now. Two months don’t make a trend, and so it will take continued prints like these to fully satisfy the Fed officials that inflation has been subdued. Still, every journey starts with a single step, and so far, we are two steps into that process.
Notice we haven’t said anything about what 12-month inflation rates are. Anyone who has studied the statistical analysis of time series knows that a 12-month average tells you what was happening six months ago, NOT presently. Folks who are fixated on 12-month inflation data will get the inflation news six months after everyone else. Granted, two months of satisfactory prints are most likely not enough for the Fed, but there is no reason to think that the Fed will wait for 12 months of benign data before pausing or reversing its rate hikes.
For the record, a 12-month inflation rate will go down anytime this month’s inflation is lower than that 12 months ago, and vice versa. In the chart, we have highlighted the July 2022 annualized rate, and you can see that July 2023 came in slightly lower, so that the 12-month rate declined slightly. (While the chart shows core inflation ex shelter, our statement holds for the all-core and headline CPI measures as well.)
August 2022 and September 2022 inflation prints bounced a bit, at 7%+ annualized rates in both months. So, August 2023 and September 2023 prints anywhere near those of recent months will bring the 12-month inflation rate down substantially further. There is no likelihood of 12-month inflation rates stabilizing—let alone bouncing—until the October 2023 print, and by then, it likely won’t matter. That is, if monthly inflation prints continue to be benign through October—making a five-month string—that should be enough for the Fed to be satisfied regardless of how 12-month inflation is behaving.
One important last point is that our analysis here has concerned the CPI, but the Fed’s inflation targets are actually focused on the Personal Consumption Expenditures (PCE) price index. PCE inflation is shown by the green line in the chart, and July data for it won’t be available until August 31. Still, the trends for PCE inflation have been comparable to those for CPI inflation, and there is reason to believe that the July PCE inflation print will also be benign. Note from the chart that ex-shelter PCE inflation in June was not negative the way the CPI was. However, at 1.4% annualized, it was within the Fed’s 2% target range, and a similar July print will make two months and counting for this measure as well.