
Main Points
- Given the rise in spreads and government bond yields, we currently view high-yield valuations at around 9% to be attractive.
- Higher rates and greater uncertainty have led to lower asset valuations and some recession risk is priced in—but if equity multiples decline to recession levels then stocks could decline by more than 20% and high-yield may be close to flat over the next year.
- We see value in credit markets, but advocate an actively managed approach. We like industries with pricing power and avoid those without it—the latter has more risk of default should growth slow more than our base case. We see value in public markets as valuations have improved relative to middle market and private debt.
What Happened in Levered Credit Markets This Year?
In below-investment-grade corporate credit markets, yields have risen by over 4.5 percentage points in the first half of the year, leaving high-yield benchmarks near 9%. Most fixed-income asset categories experienced outflows in the first month or two of the year as government bonds repriced to expectations that the Fed would increase the fed funds rate to neutral much sooner given persistently high inflation. Then, outflows from fixed-income funds accelerated around the end of the first quarter after Russia invaded Ukraine, and the combination of higher oil and gas prices along with Covid policy-related bottlenecks in other countries pushed inflation even higher. Over the first two quarters, the market priced in greater risk of a hard landing. Then in June alone, high-yield spreads widened more than 150 bps while stocks declined over 8%.
How Did Rising Rates Impact the Corporate Market?
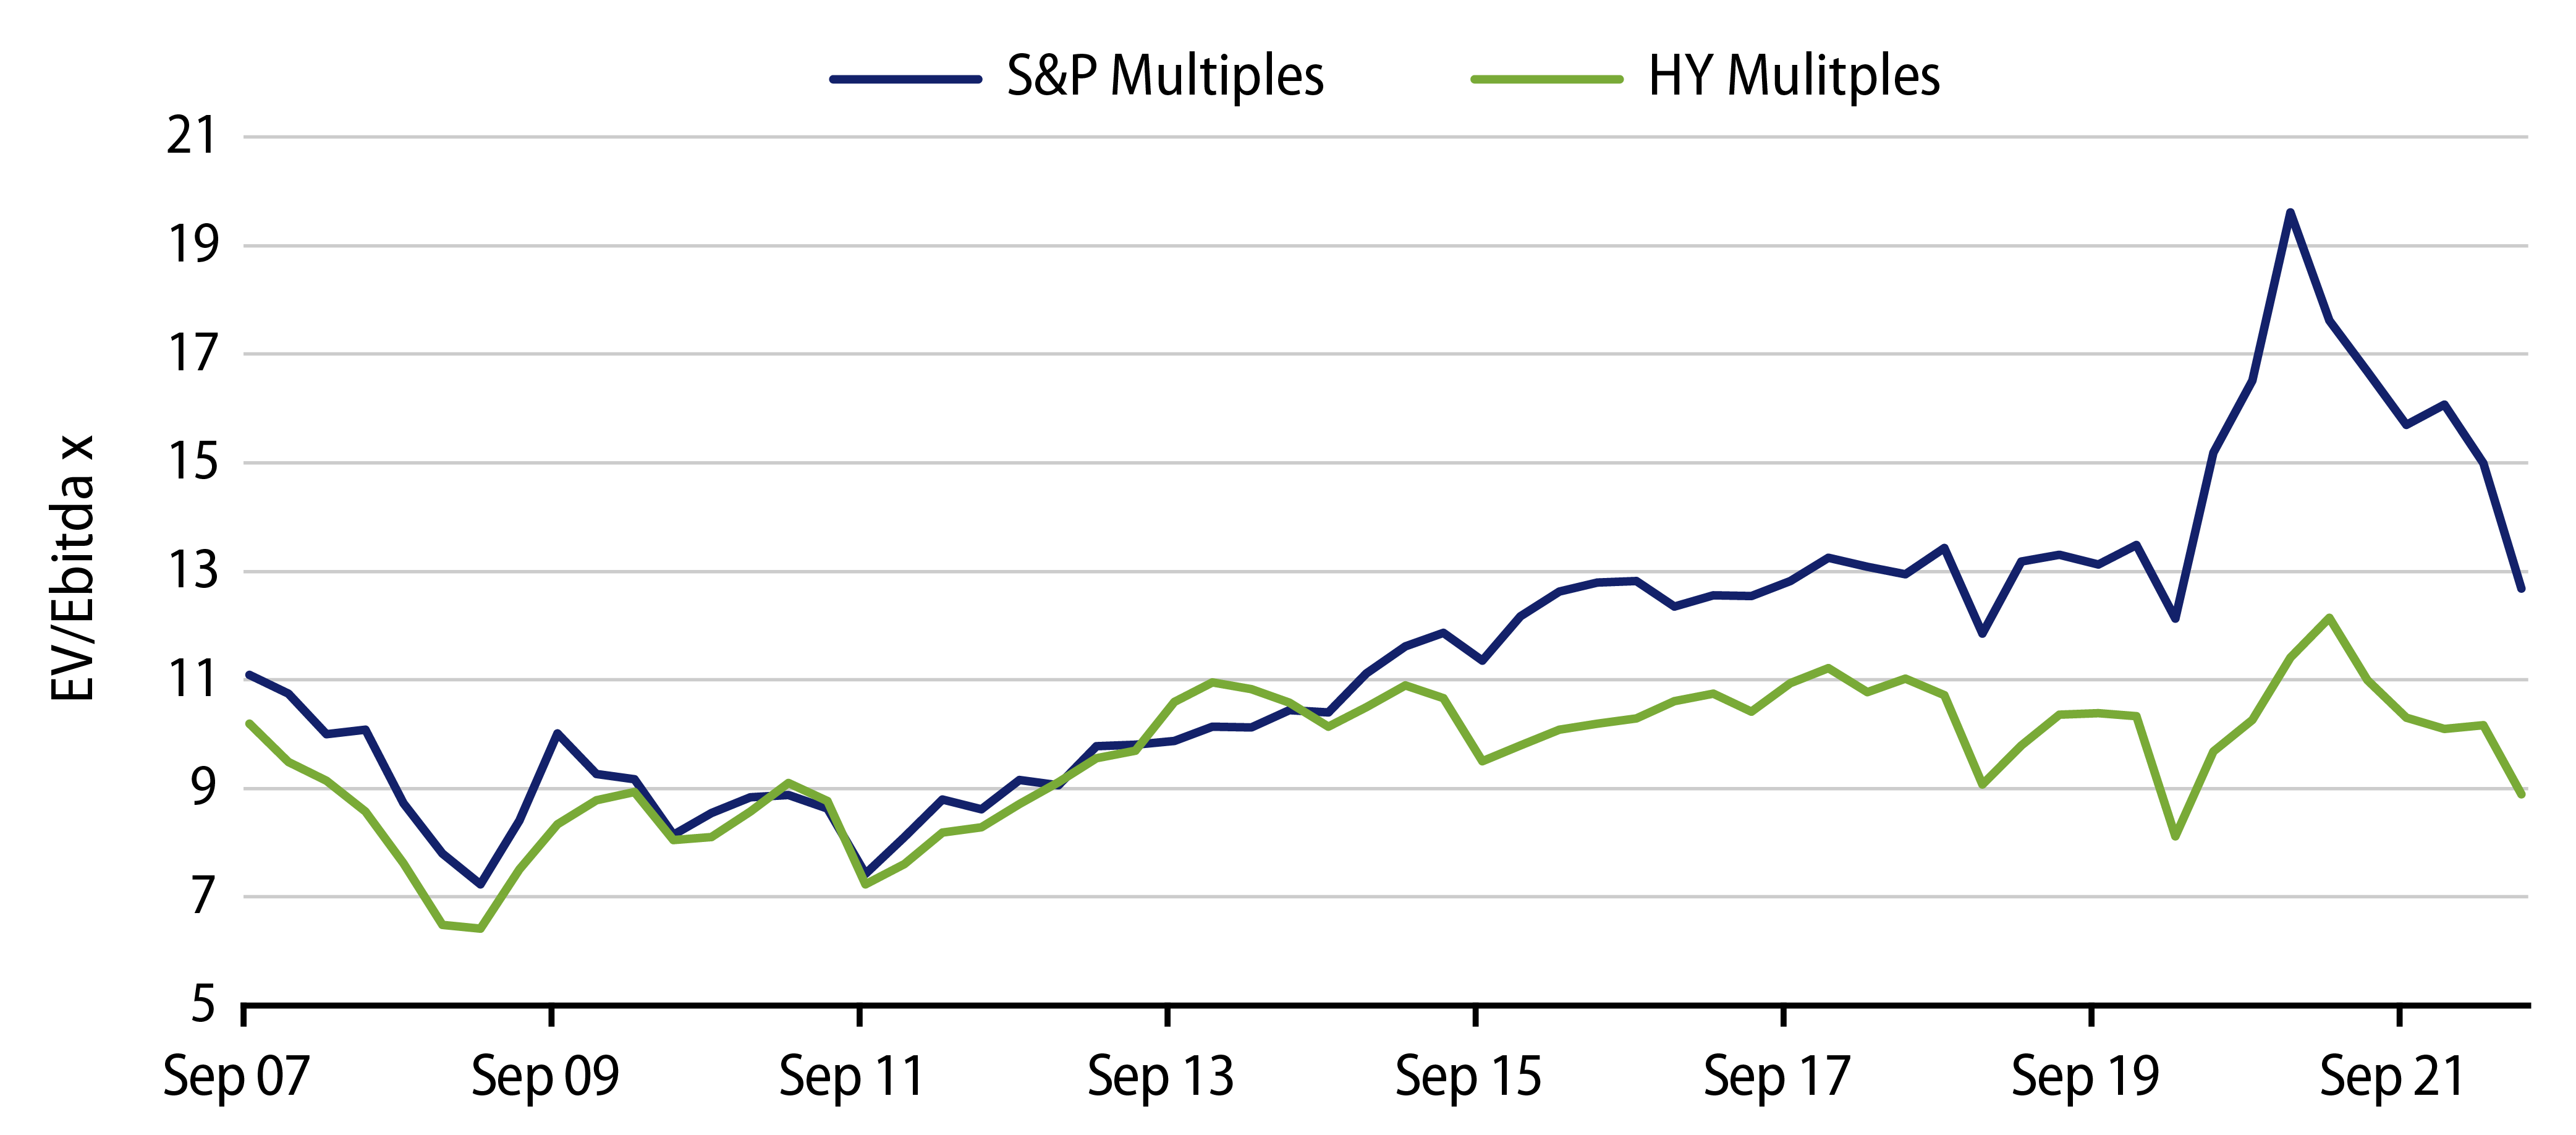
As interest rates rose along with uncertainty around how restrictive Fed policy would need to be to slow inflation, asset price multiples declined. In high-yield markets, enterprise value relative to EBITDA declined by 12% year to date, to 8.8x, which is a little less than the decline in asset multiples for the S&P 500, which fell to 12.8x. Issuer composition and weightings likely explain some of the differences, but the magnitude and direction of multiples investors pay on assets changed similarly despite still-strong corporate fundamentals. For background, corporate fundamentals entered this period of uncertainty well prepared. On average over the four quarters ending in March 2022, EBITDA grew more than 15% on average for high-yield companies, margins expanded as corporations raised prices to customers more than their input costs and most measures of leverage declined on a year-over-year basis with earnings and cash flow rising faster than debt, according to Morgan Stanley research as of March 2022.
Have Asset Multiples Declined to Recession Levels?
Compared to where they are now, equity multiples would likely be lower and high-yield spreads would probably be wider in a recession. For example, should the S&P 500’s EV/EBITDA multiple decline to an average of the last two recessions of approximately 9.7x (i.e., 12.1x + 7.3x/2), then stocks may decline by another 24% or more, which could be similar to their total return for a year assuming dividends don’t increase.
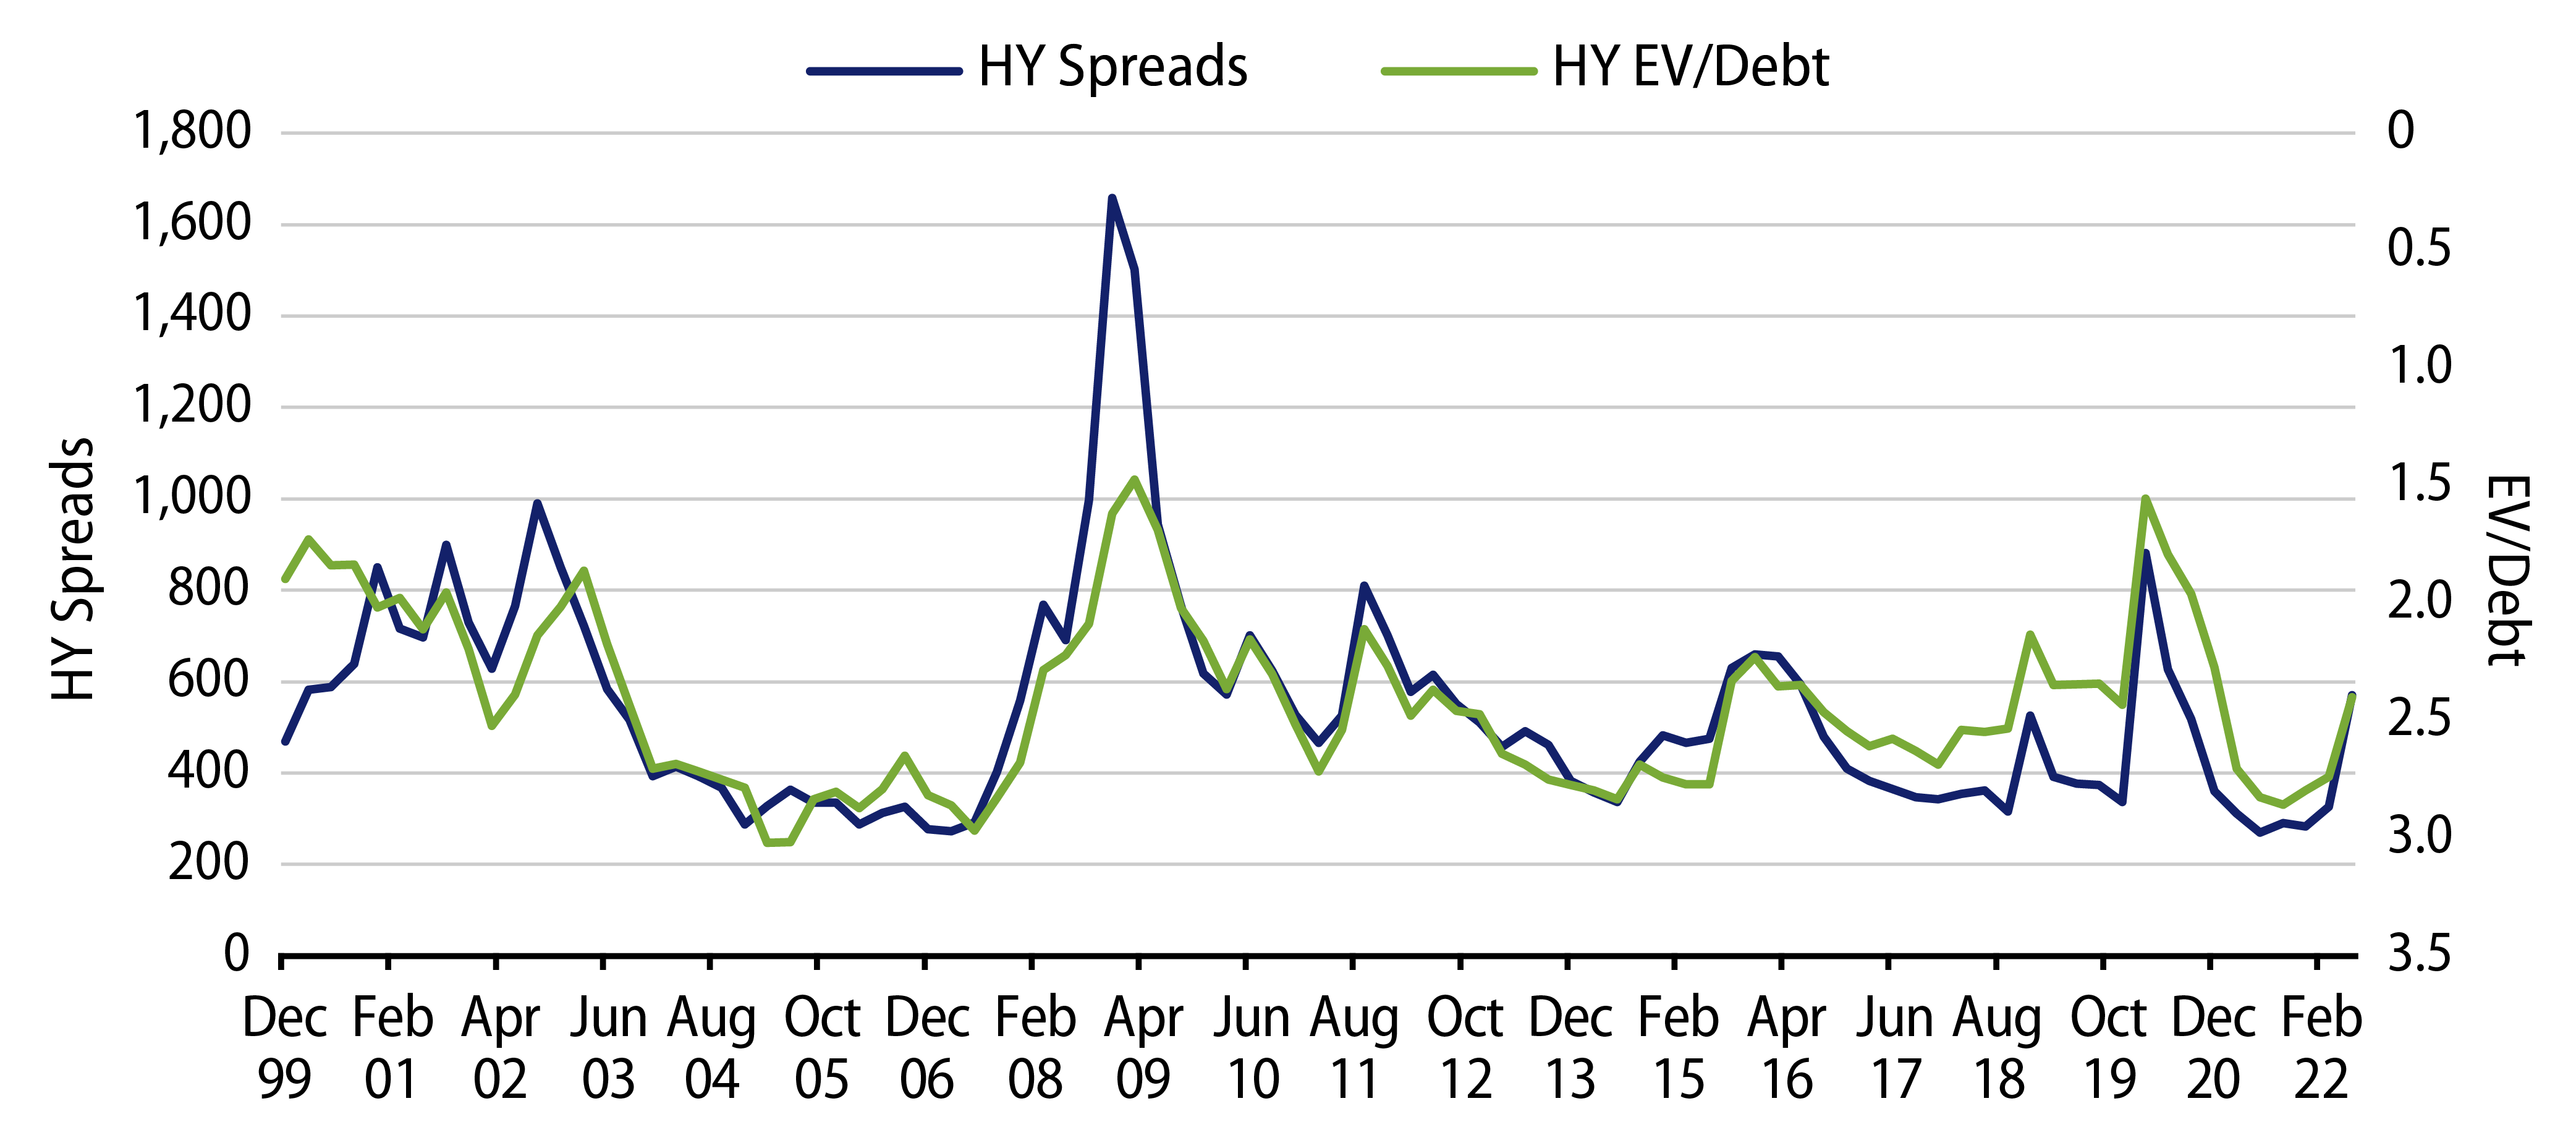
If equity multiples declined another 24% from current levels, and we applied the same equity multiple decline to the enterprise value for high-yield companies, their asset coverage would decline and spreads would almost certainly widen. In high-yield credit, a 24% decline in enterprise value would result in asset coverage (i.e., enterprise value/debt) declining from 2.4x at the end of 2Q22 to nearly 1.8x, assuming debt doesn’t increase. Note that 1.8x asset coverage is still about 20% above its previous recession levels in 2009 and 2020. That said, a 1.8x asset coverage could imply spreads would widen to about 800 bps from 570 bps at the end of June.
What’s the Outlook?
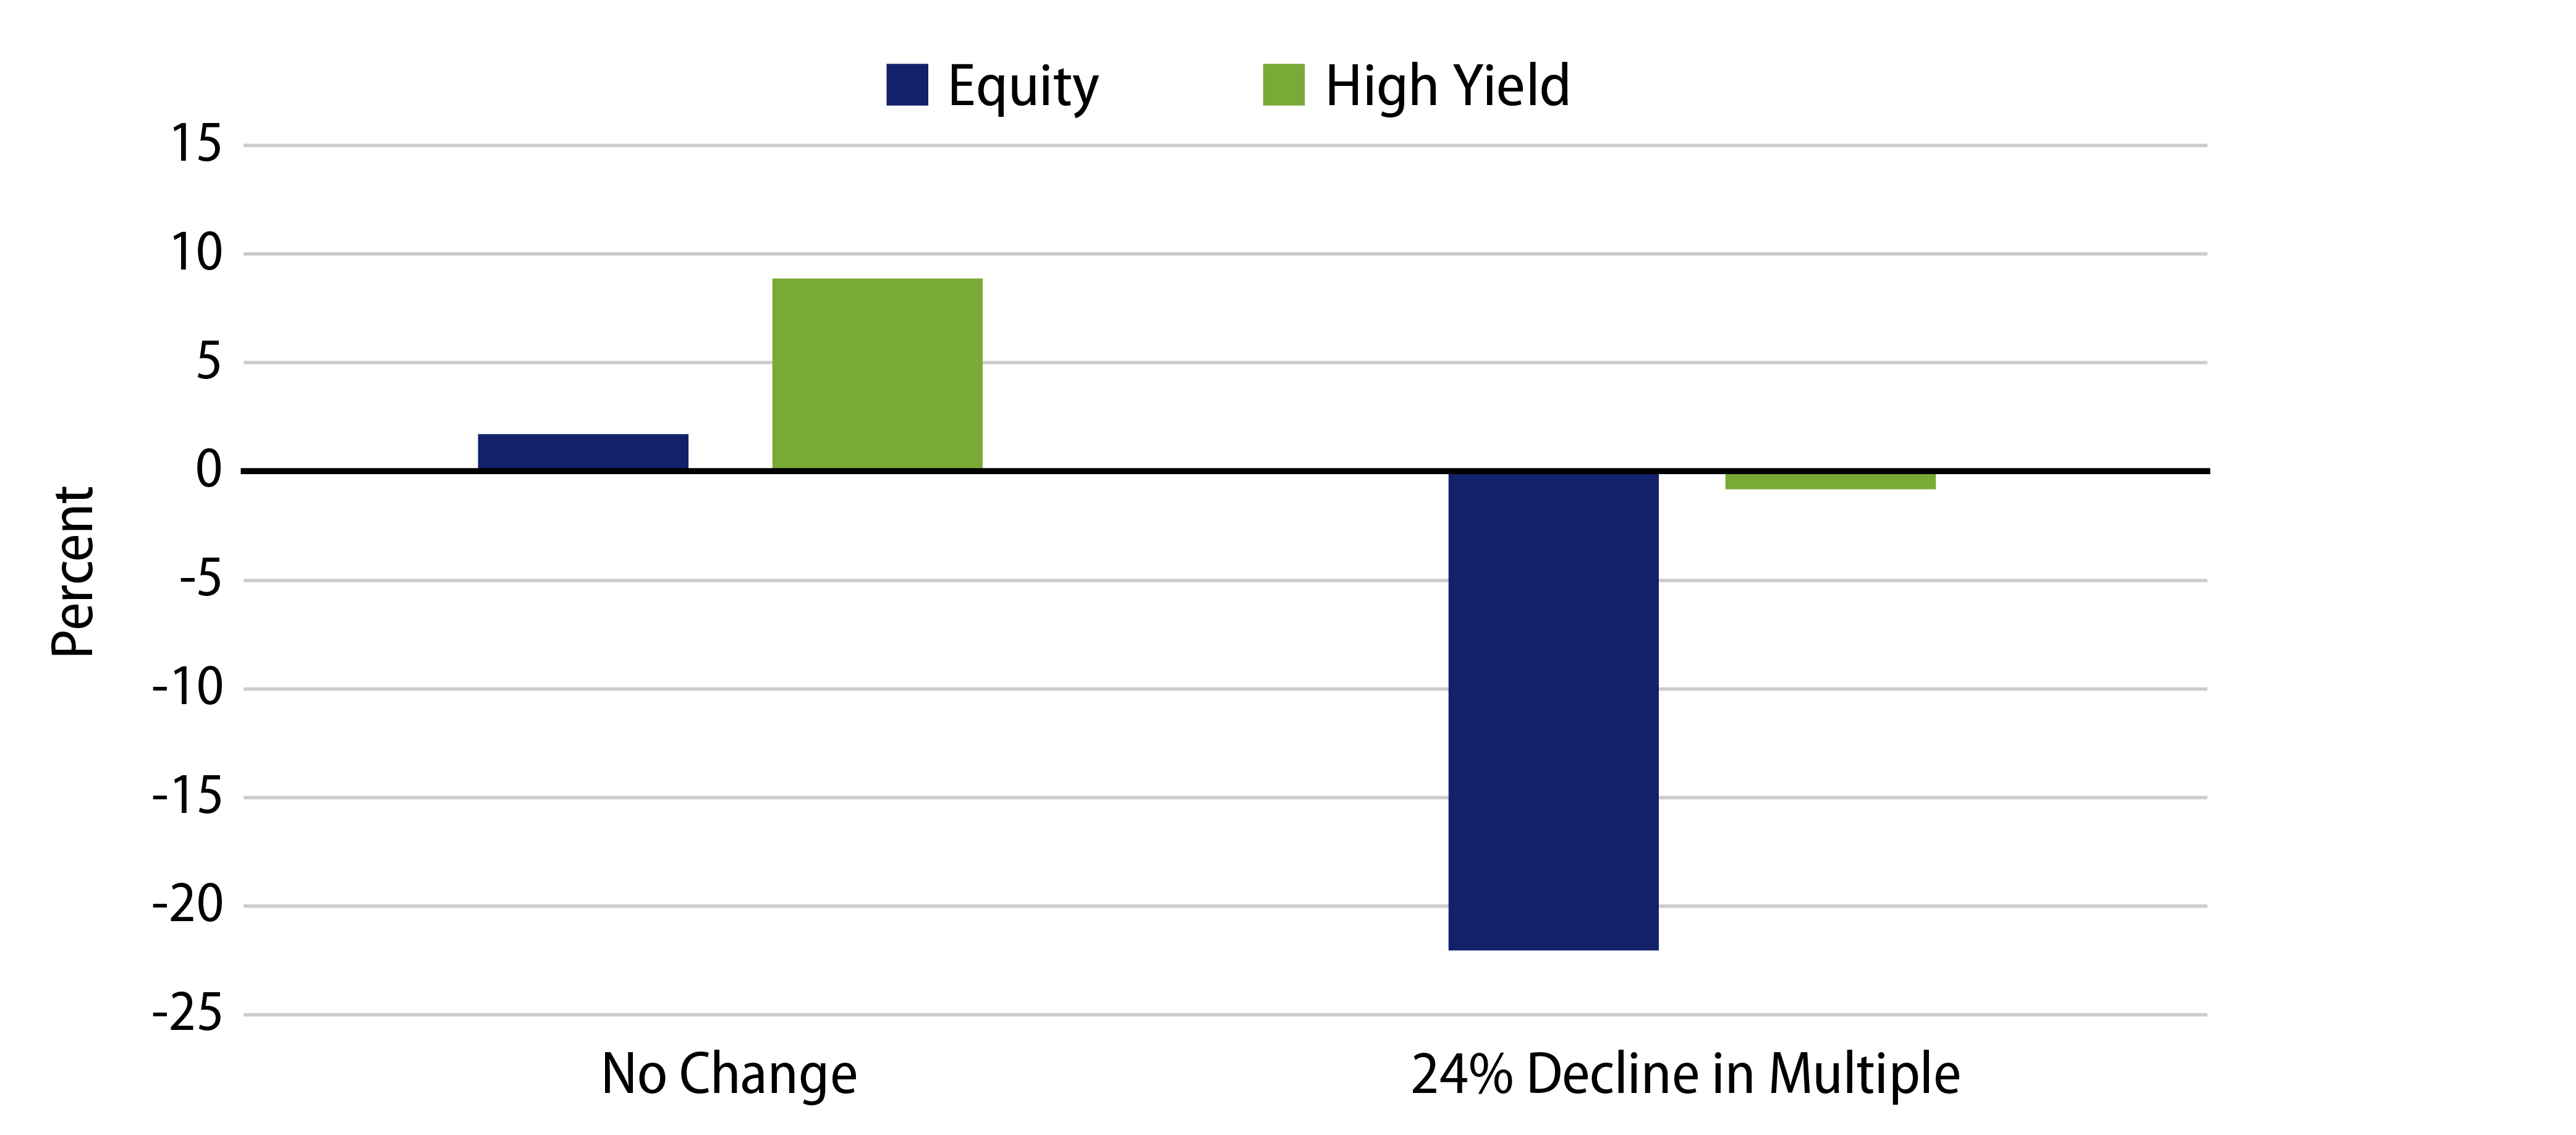
At current yields, high-yield may offer equity-like returns with lower risk. While the potential outcomes will depend on many factors, for simplicity let’s look at two possible scenarios: (1) multiples remain stable and (2) equity multiples decline 24% to be in line with the last two recessions.
In the first scenario, where asset multiples don’t change, the equity returns would largely be from dividends, so that would be closer to 1.7% based on the S&P 500 dividend yield as of 2Q22. As for high-yield, yields of approximately 9% at quarter-end would suggest a potential return that is similar if equity multiples don’t decline. This potential return assumes that Treasury yields and spreads don’t change, and it also assumes losses from defaults could be avoided.
If equity multiples decline by 24%, applied equally to high-yield and the S&P 500, then stocks would likely have a total return of -22% assuming some income from dividends and high-yield may have a return very close to 0%. This scenario assumes no defaults and also no benefit from potentially declining government bonds.
While this analysis is a bit simplistic, it’s meant to illustrate that equity returns should look less compelling as asset multiples are still elevated. In addition, if multiple expansion doesn’t provide additional return for equity, then dividend yields would need to increase to improve the outlook for returns. With regard to credit, yields near 9% should provide for historical equity-like returns, but with lower volatility. Furthermore, should correlations between government bond yields and spreads revert back to their historical inverse relationship, then high-yield credit volatility would likely decline too.
At Western Asset, we see a lot of opportunity in credit, but advocate taking an active approach. While corporate sector balance sheets improved significantly since 2020 and debt maturities have largely been pushed out to 2025, we will likely see defaults increase over the coming year as growth slows, but defaults should remain below historical averages. We are finding more value in “reopening” industries, like airlines and lodging, and are more cautious on durable goods sectors and housing-related goods, where companies in those industries are adjusting to changing supply and demand trends while losing pricing power. We see opportunity in floating-rate, structured credit and fixed-rate segments of the market. We remain very selective with middle-market and private credit given the valuation improvement in public debt markets.