

Private-sector payrolls rose by only 30,000 jobs in July, according to data released today by the Bureau of Labor Statistics (BLS). On top of that, private-sector payroll estimates for June were revised down by -55,000. This report is softish, but it is not the calamity some press reports make it out to be.
First, the negative “headline” number (i.e., total nonfarm payrolls) was due to a big (-50,000) decline in public school jobs that was likely a seasonal blip. Variations in the timing of summer vacations often lead to big swings up or down in school jobs over June-October. Today’s data are merely the latest edition of this. Most of the downward revisions to June jobs were also in schools, both public and private.
Second, while private jobs outside of health care were flat in both June and July (after revisions), this comes after outsized gains in March and April. What’s more, even zero growth for non-health care/social services private jobs is an improvement over what we saw in these sectors over 2023-2025.
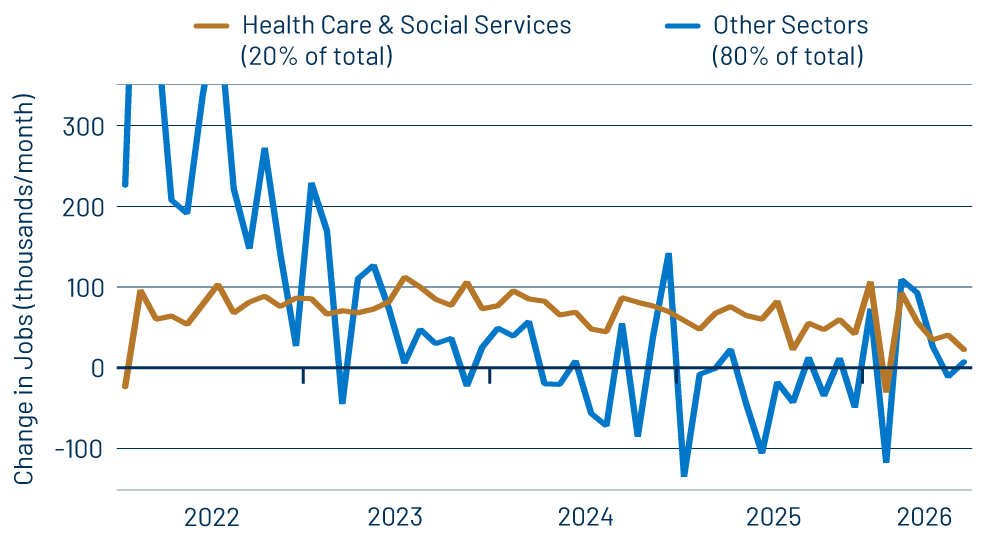
For 2026 to date, average monthly private-sector payroll job growth has been +26,000 per month excluding health/social and +46,000 per month in health and social. This compares to average rates of -33,000 per month and +57,000 per month for these sectors, respectively, for all of 2025. (And if you think we should compare January-July of 2026 only to January-July of 2025, the numbers show even more improvement this year, as respective averages for the first seven months of 2025 are -41,000 and +65,000.)
In other words, in the private sector outside health care and social services, job growth is actually much stronger in 2026 than what it was in 2025—or 2024 or late 2023, for that matter. Health care and social services essentially carried job growth single-handedly over those years, but growth has been more evenly distributed this year, though, yes, growth in health and social has slowed. And, yes, current job growth rates are hardly rapid, but, again, they are of a piece with—actually slightly better than—what was seen over the previous three years.
What’s going on? An obvious scapegoat is the immigration clampdown, but that doesn’t hold up under close inspection. Let’s remember that job growth first slowed to a crawl in 2023, when immigration flows were considerably stronger. Growth in average wages has been slowing as well, and yet a dearth of migrant labor should work to elevate average wages. Average hourly wages rose just 0.1% in July and are up only 3.1% over the past 12 months, inconsistent with a claim that reduced immigration is holding back the labor market this year.
We think a more likely explanation for the slow job growth since 2022 is that, coming out of the pandemic, employers stockpiled workers when they could, and they have been working off this stockpile in recent years.
However you slice it, today’s data point firmly against a Federal Reserve (Fed) rate hike in the near future. Most Fed officials are labor market economists before they are monetary economists, and there is nothing in any of the payroll or unemployment data suggesting a hike. While job growth is up from last year and before, it is still sluggish, as we have already stated. Meanwhile, wage growth of 3% is more than amply low enough to be consistent with 2% inflation. Above-target inflation, where it exists, is coming from factors other than the labor market—or even the economy—and would seem to us to be outside the purview of the Fed.
We’ll close with some details on the gender distribution of the job force. We recently saw a piece making much of the fact that women now outnumber men in payroll jobs, so the BLS data on gender distribution in today’s payroll report caught our eye. Exhibit 2 is taken straight from that report, without alteration (Table B-5 of the BLS employment report if you are interested). Yes, women fill a (bare) majority of payroll jobs, 50.1%. That becomes a minority of 48.6% when focus shifts to the private sector.
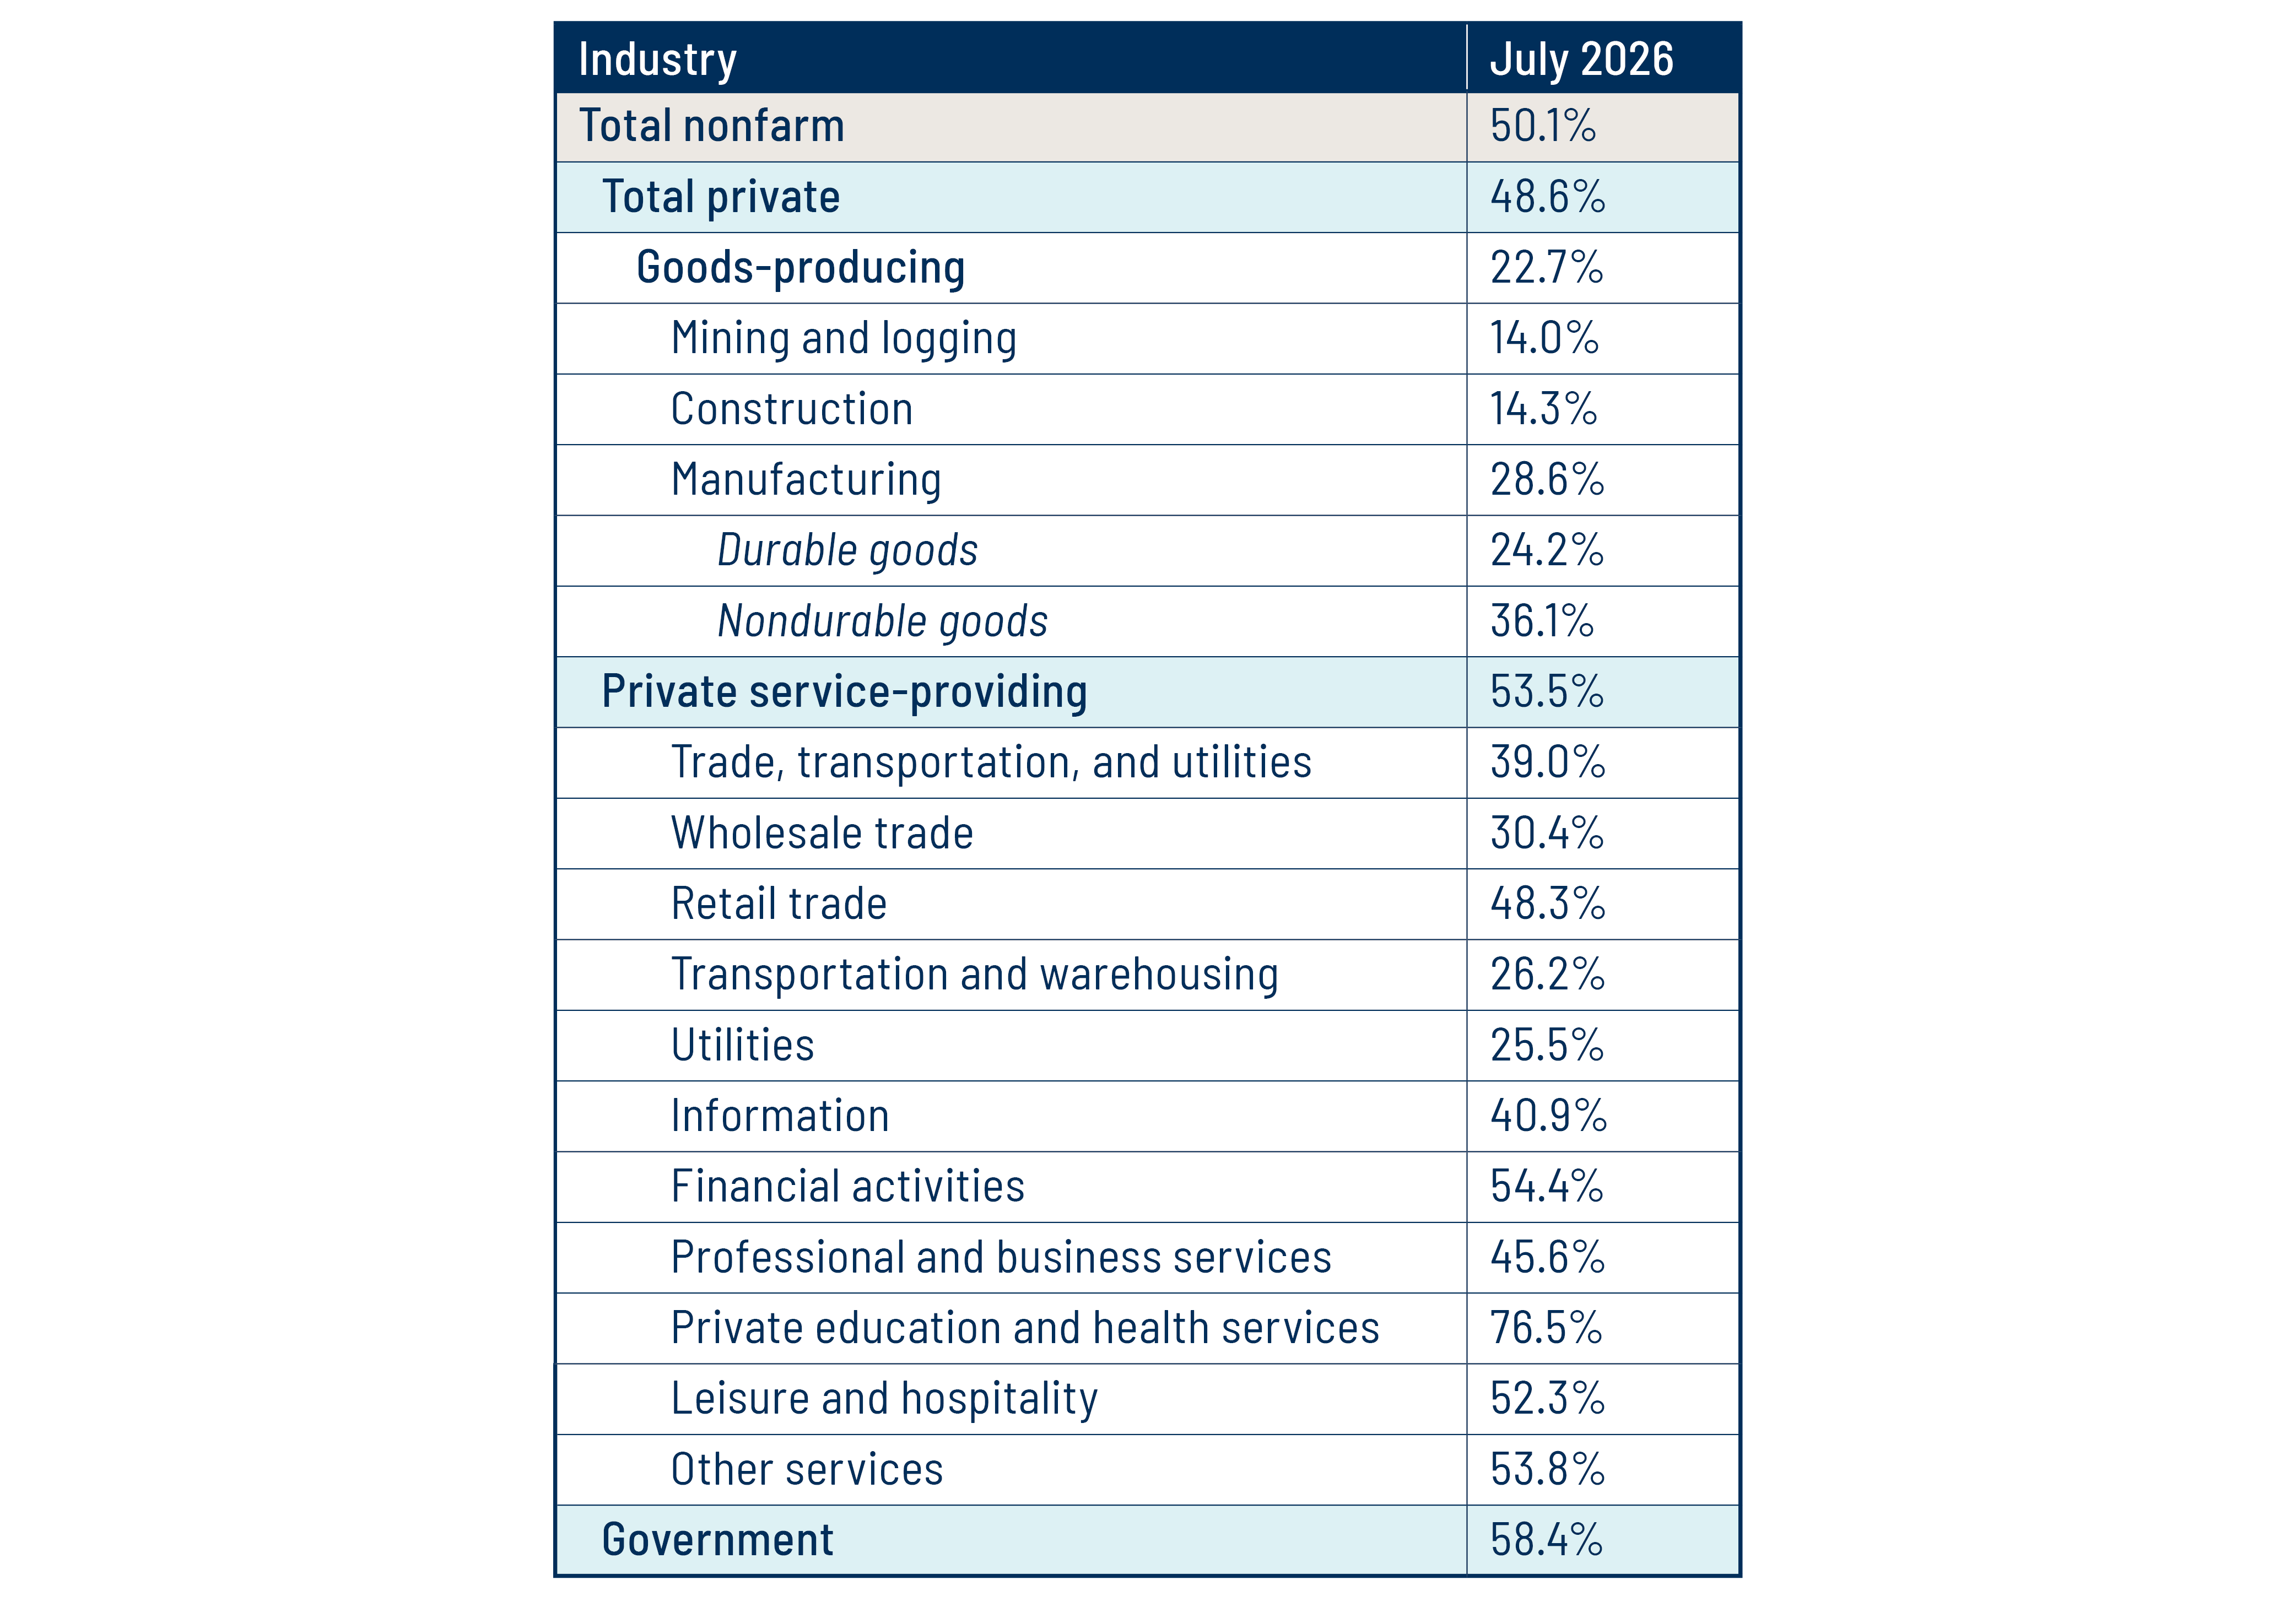
And when we focus further on “goods-producing” sectors, the bulk of heavy industry, these are still male-dominated, with only nondurable manufacturing showing even 36% of the workforce as female. Keep in mind, too, that these stats include office workers within these sectors.
Even in service-producing sectors, the only areas with predominantly female workforces are finance, education/health care and leisure/hospitality. In service-producing, too, the heavy industry sectors of transportation/warehousing (logistics) and utilities are still heavily male dominated. It is surprising to see that even in retailing, male workers still constitute a majority.
Who knows what the significance of all this is, but we thought it an interesting nuance to add to the story of women now holding a majority of payroll jobs. Finally, note also that women’s 50.1% share of the job force compares to their 51.8% share of the working-age population.