

Headline retail sales rose 0.2% in June, according to data released today by the Census Bureau. That seemingly modest gain was buoyed by an upward revision of +0.4% to the May sales estimate and by the fact that prices were lower in June, with retail gasoline prices down -9.7% and “core” goods prices down -0.1%. We and other analysts focus on a “control” sales measure that excludes sales at vehicle dealers, service stations, building material stores and restaurants, partly because of the month-to-month volatility in these sectors and partly because we want to focus on store types frequented predominantly by consumers rather than other businesses. That control sales measure was up even more strongly in June, by 0.5%, with a +0.2% revision to its May sales estimate.
Exhibit 1 shows the recent behavior of control sales, and you can see the clear acceleration there so far in 2026 in both nominal and real terms. We should point out that our estimates of real sales over January-April may overstate gains, as our price data are based on Consumer Price Index (CPI) estimates of merchandise prices, and Personal Consumption Expenditures (PCE) price index data showed substantially higher inflation over January-April than did CPI data. However, it is open to question as to which measure is more reflective of actual retail prices; in any case, the two price measures were back in harmony in May, and there is reason to believe they will be similarly coherent in June.
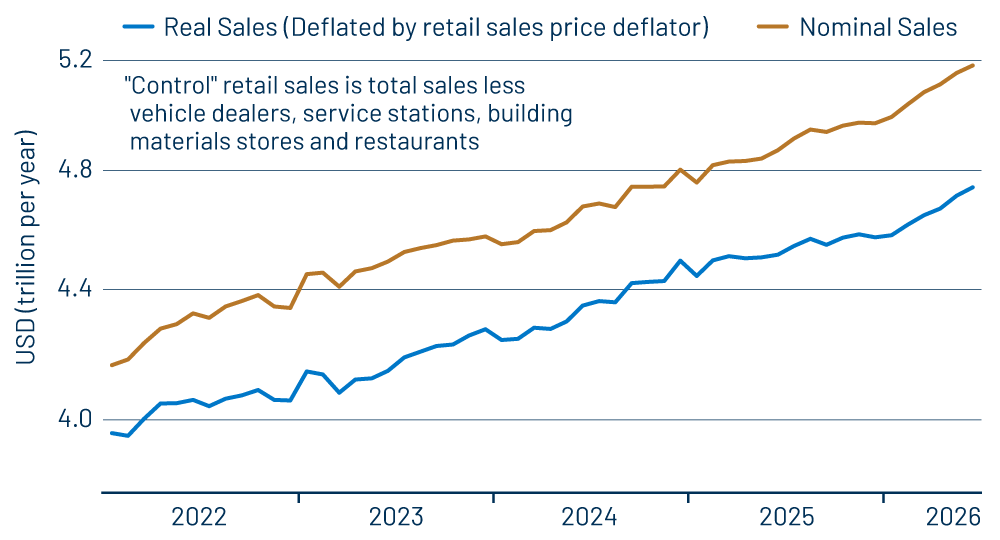
Sorry for the wonky detail, but in these post-shutdown days of highly volatile data, one must point out the possible “issues” with the numbers. Regardless, it is worth reflecting that just four months ago analysts were fretting that consumer spending might have been softening even before the Iran conflict emerged. The data since then have indicated an upturn—if anything—in consumer spending, and this has been sustained despite the tensions abroad and at the pump.
As already stated, gas prices pulled back substantially in June, and we’ll see how much of that is sustained with the July resumption in hostilities. For other store types, sales have been rising nicely over recent months everywhere except at drug and apparel stores, and even there, sales have been flat rather than declining. The most notable pickups in sales have been at electronics stores, online vendors and restaurants. Consumer spending is not growing rapidly, but it is showing at least a healthy uptrend, with those gains distributed widely across various store types.
We’ve already mentioned the benign June inflation data, and Exhibit 2 shows both the June data as well as the preceding months’ gaps between CPI and PCE inflation measures (which are supposed to report the same thing: consumer inflation). We show core prices excluding shelter, partly to exclude volatile food and energy prices and partly to abstract from shelter prices, which popped in the early months of 2026 even though home prices were stable. The fact is that all elements of CPI inflation behaved benignly in June. Again, fuel prices were down sharply; food prices were stable; core goods prices declined at the same slight rate as seen in May; shelter prices rose only a slight 0.1%; and core service prices other than shelter declined a substantial -0.2%, after they had shown relatively rapid gains in April and May.
As you can see from Exhibit 2, consumer prices have seen wild month-to-month swings recently even after we abstract from the especially volatile energy, food and shelter sectors. Average these short-term ups and downs, and this measure is up only 2.0% over the last year. (Overall core CPI—that is, including shelter—is up 2.4% over the last year.) This is right at the Federal Reserve’s (Fed) inflation target. The problem is that the Fed’s official inflation target relies on PCE inflation data, and as the caption in Exhibit 2 states, the PCE core inflation measure has risen much more over the past year than has core CPI.
This is mostly due to the unprecedentedly large gap in core goods price inflation that these measures show from December 2025 through April 2026. As also mentioned earlier, the two measures were more in sync in May, and hopefully that coherence will continue in June and after. Meanwhile, the Fed’s preference for the PCE over the CPI measure arose in an era when the differences between the two indices were slight, and it was a matter of preference rather than exclusive focus. With the differences now more glaring, the Fed will have to pay at least some attention to CPI inflation data as well as what the PCE is saying.