
Around 15 years ago, early adopters of liability driven investing (LDI) began reducing long-held duration underweights (vis-à-vis the liabilities). Initially, this was done using off-the-shelf long duration indices like the Bloomberg Barclays Long Government/Credit or Long Credit indices. This approach still bears much fruit for many plan sponsors, as we noted in Effective LDI: Don’t Sweat the Small Stuff. As time passed, improving funded status, further acceptance of de-risking goals and asset owners’ increased sophistication all helped increase demand for more customized LDI solutions.
These customized solutions sought to minimize the tracking error of asset/liability returns through a better blend of traditional, long-only fixed-income. While highly efficient in further reducing tracking error, some of the drawbacks of this approach are concentrated credit exposure and constrained opportunities for alpha in asset portfolios. This approach generally employs high quality fixed-income components (often using credit rated A or better) when developing investable liability benchmarks, and tends to favor more restrictive guidelines in an effort to further limit perceived risk in liability hedging assets. The flipside of employing higher quality fixed-income and tighter constraints is lower return potential—and it is this drawback that has given some plans sponsors pause, especially those with severely underfunded pensions, with respect to further adoption of LDI.
Introducing LDI 2.0: What if You Could Have Your Cake and Eat It Too?
Base Concept
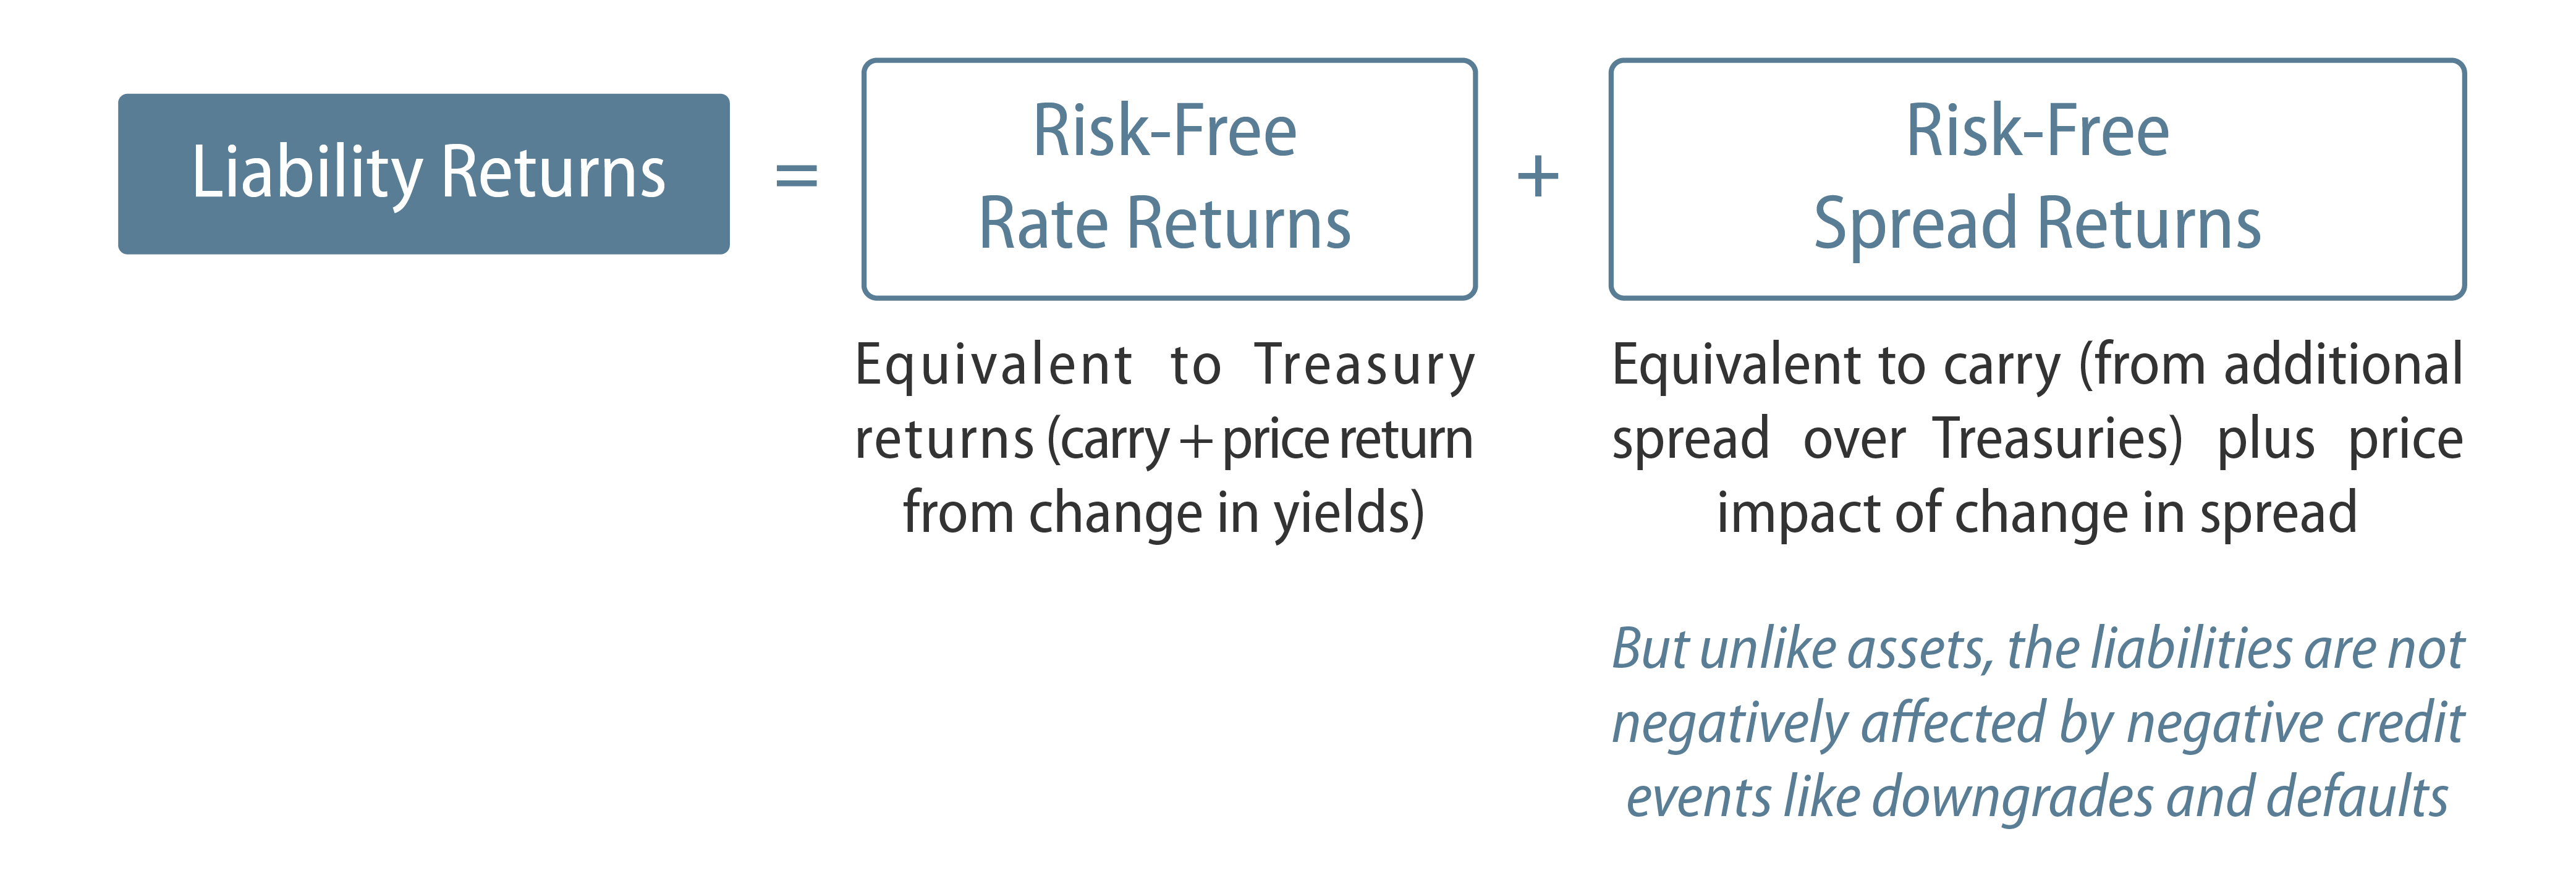
Pension liabilities are discounted with the yield of corporate bonds but possess the credit quality of Treasuries. As a result, liabilities are not negatively affected by credit events; in fact, their returns are boosted by such events. Thus, liability returns can be disaggregated into two components: a risk-free rate component and a risk-free spread component, as shown in Exhibit 1.
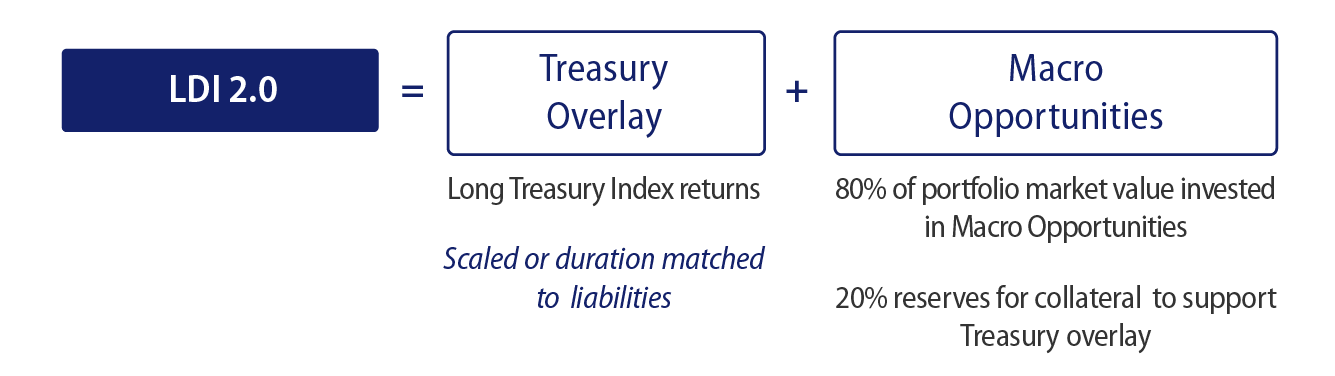
Traditional LDI (LDI 1.0) focused on long-only fixed-income with a heavy tilt toward long duration, high quality credit to gain exposure to both the duration and spread components of liability returns. At Western Asset, for LDI 2.0 we combine a credit-risk-free duration hedging component to match liability duration with a return-seeking component. Our Macro Opportunities strategy uses this flexible approach to macro investing. This combination seeks to be highly correlated to liability returns while providing a vehicle offering the opportunity for outperformance desired by plan sponsors with underfunded plans.
Proof of Concept
Exhibit 3 presents how LDI 2.0 would have performed against a proxy liability benchmark. We also include a traditional long credit mandate (LDI 1.0 strategy) for comparative purposes.
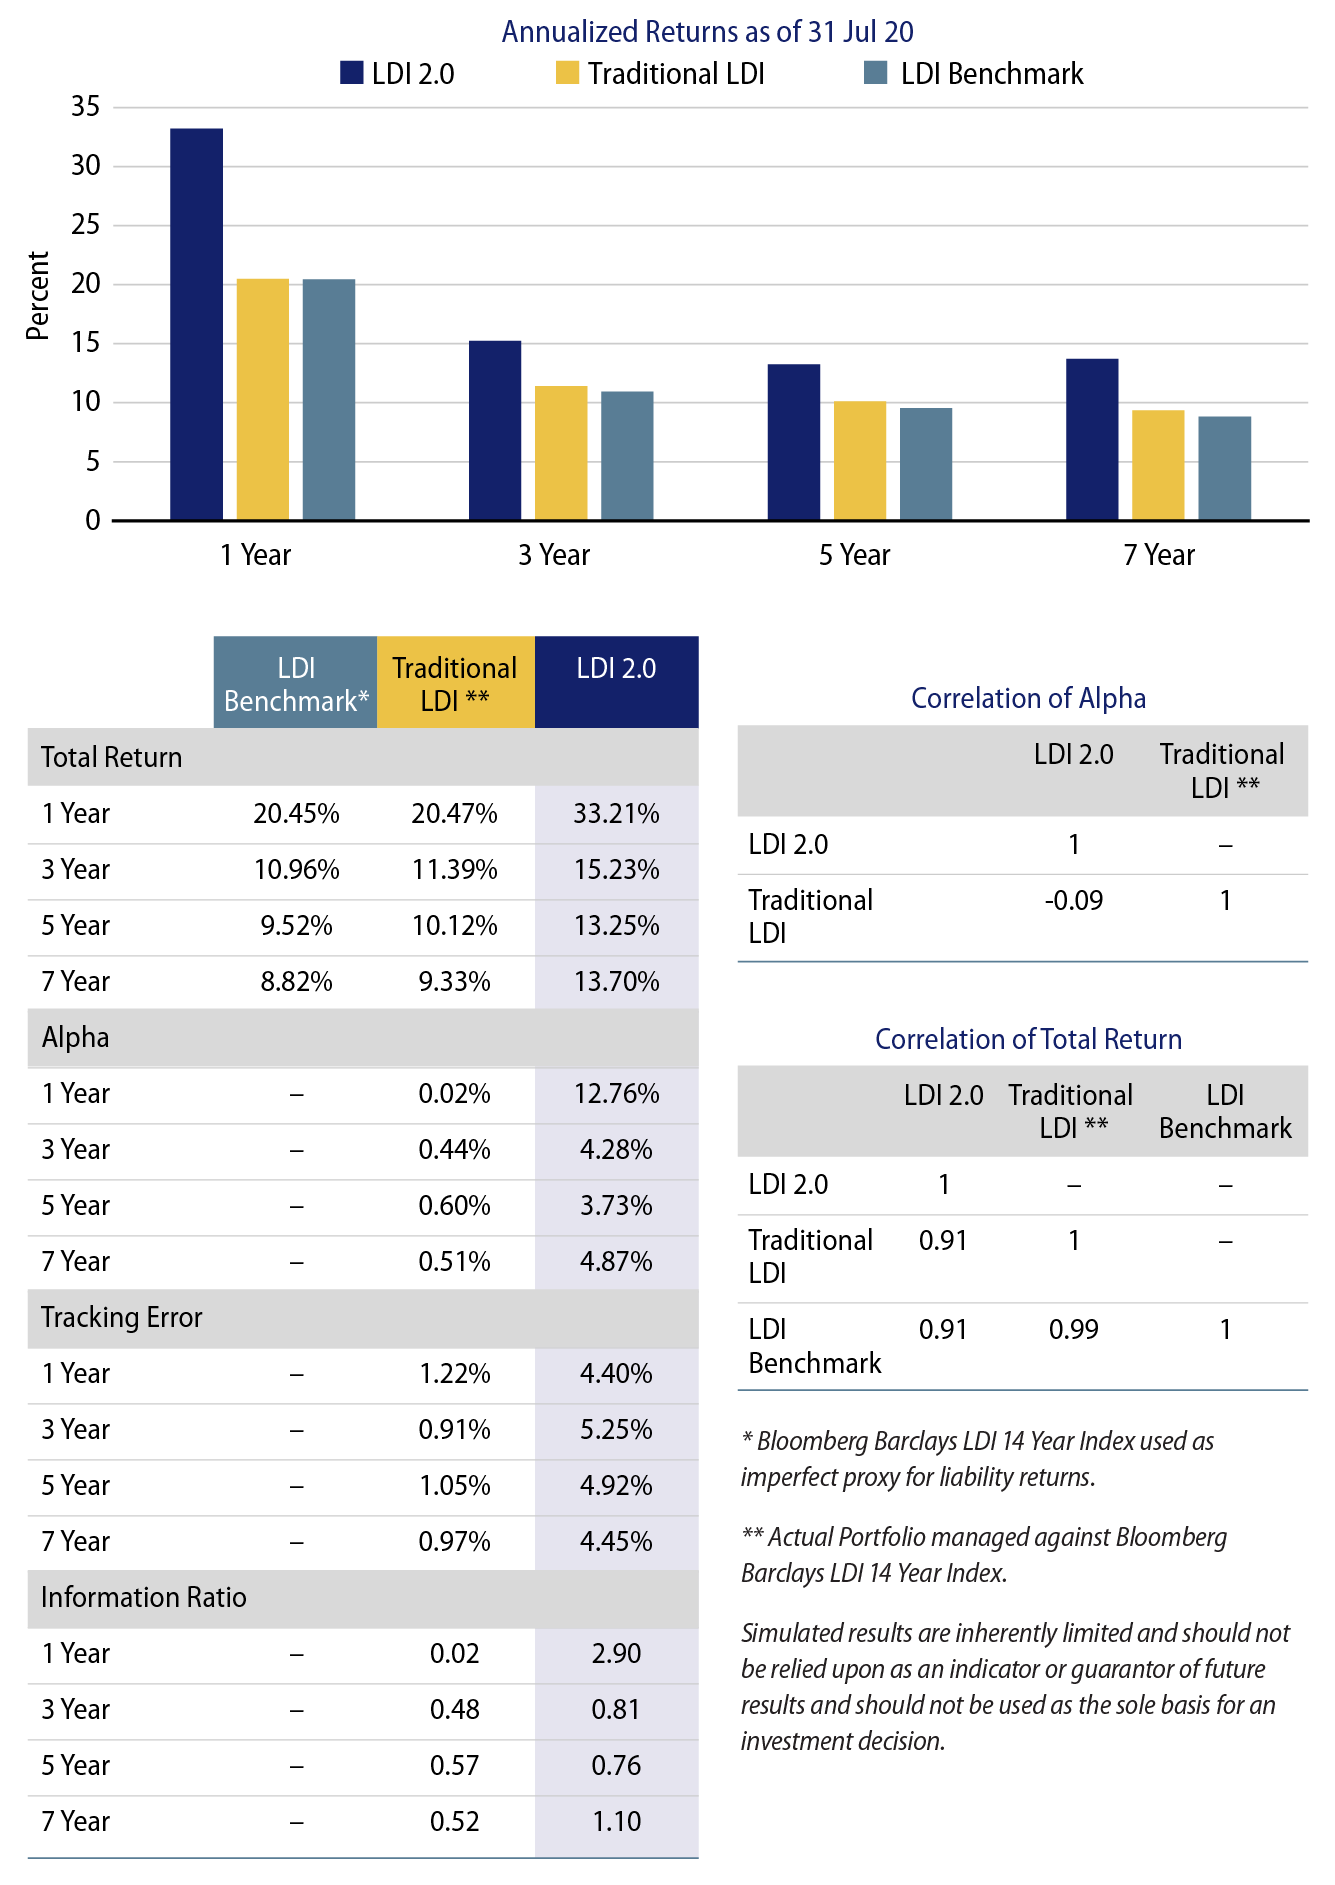
In the returns table in Exhibit 3 we see that a traditional LDI strategy has performed as desired, showing modest outperformance coupled with modest tracking error. LDI 2.0 delivers considerably more upside, albeit with more tracking error. However, the total return of LDI 2.0 has been highly correlated to the liability proxy while its alpha has not been correlated to a traditional LDI investment, both highly desirable qualities (see bottom, right-hand side tables in Exhibit 3).
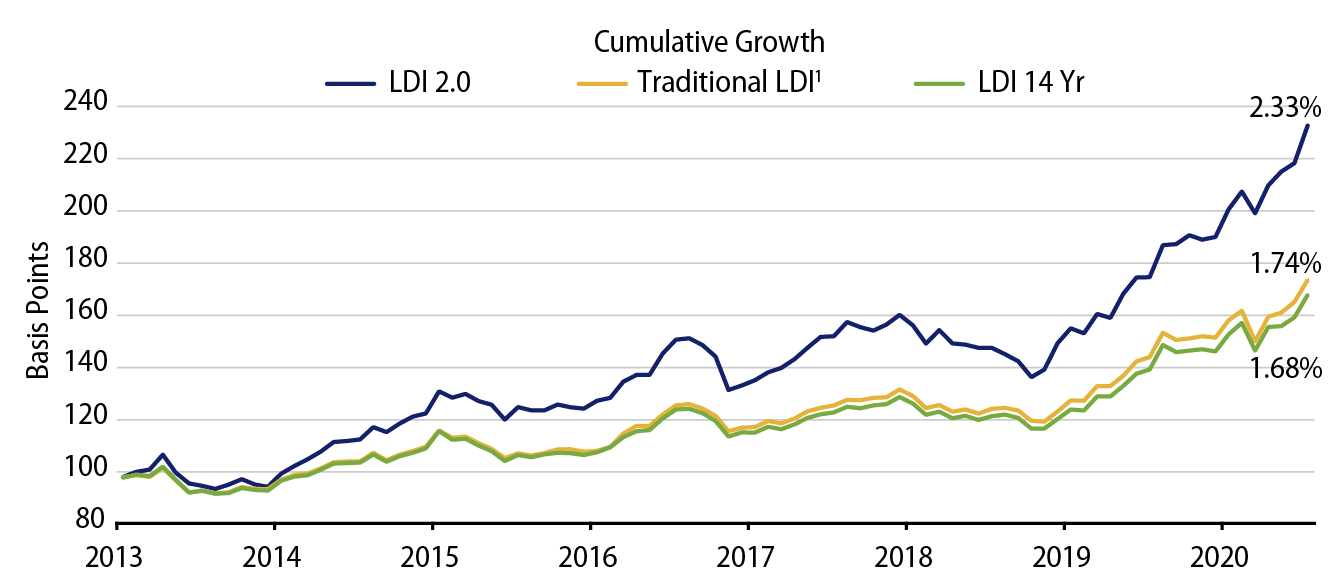
Exhibit 4 is intended to help visualize this performance over time. The cumulative growth over time chart shows that a traditional LDI strategy has performed well with modest outperformance while closely tracking the liabilities. LDI 2.0 vastly outperforms while still largely following the same zigs and zags.
Tracking the Various Funding Statuses
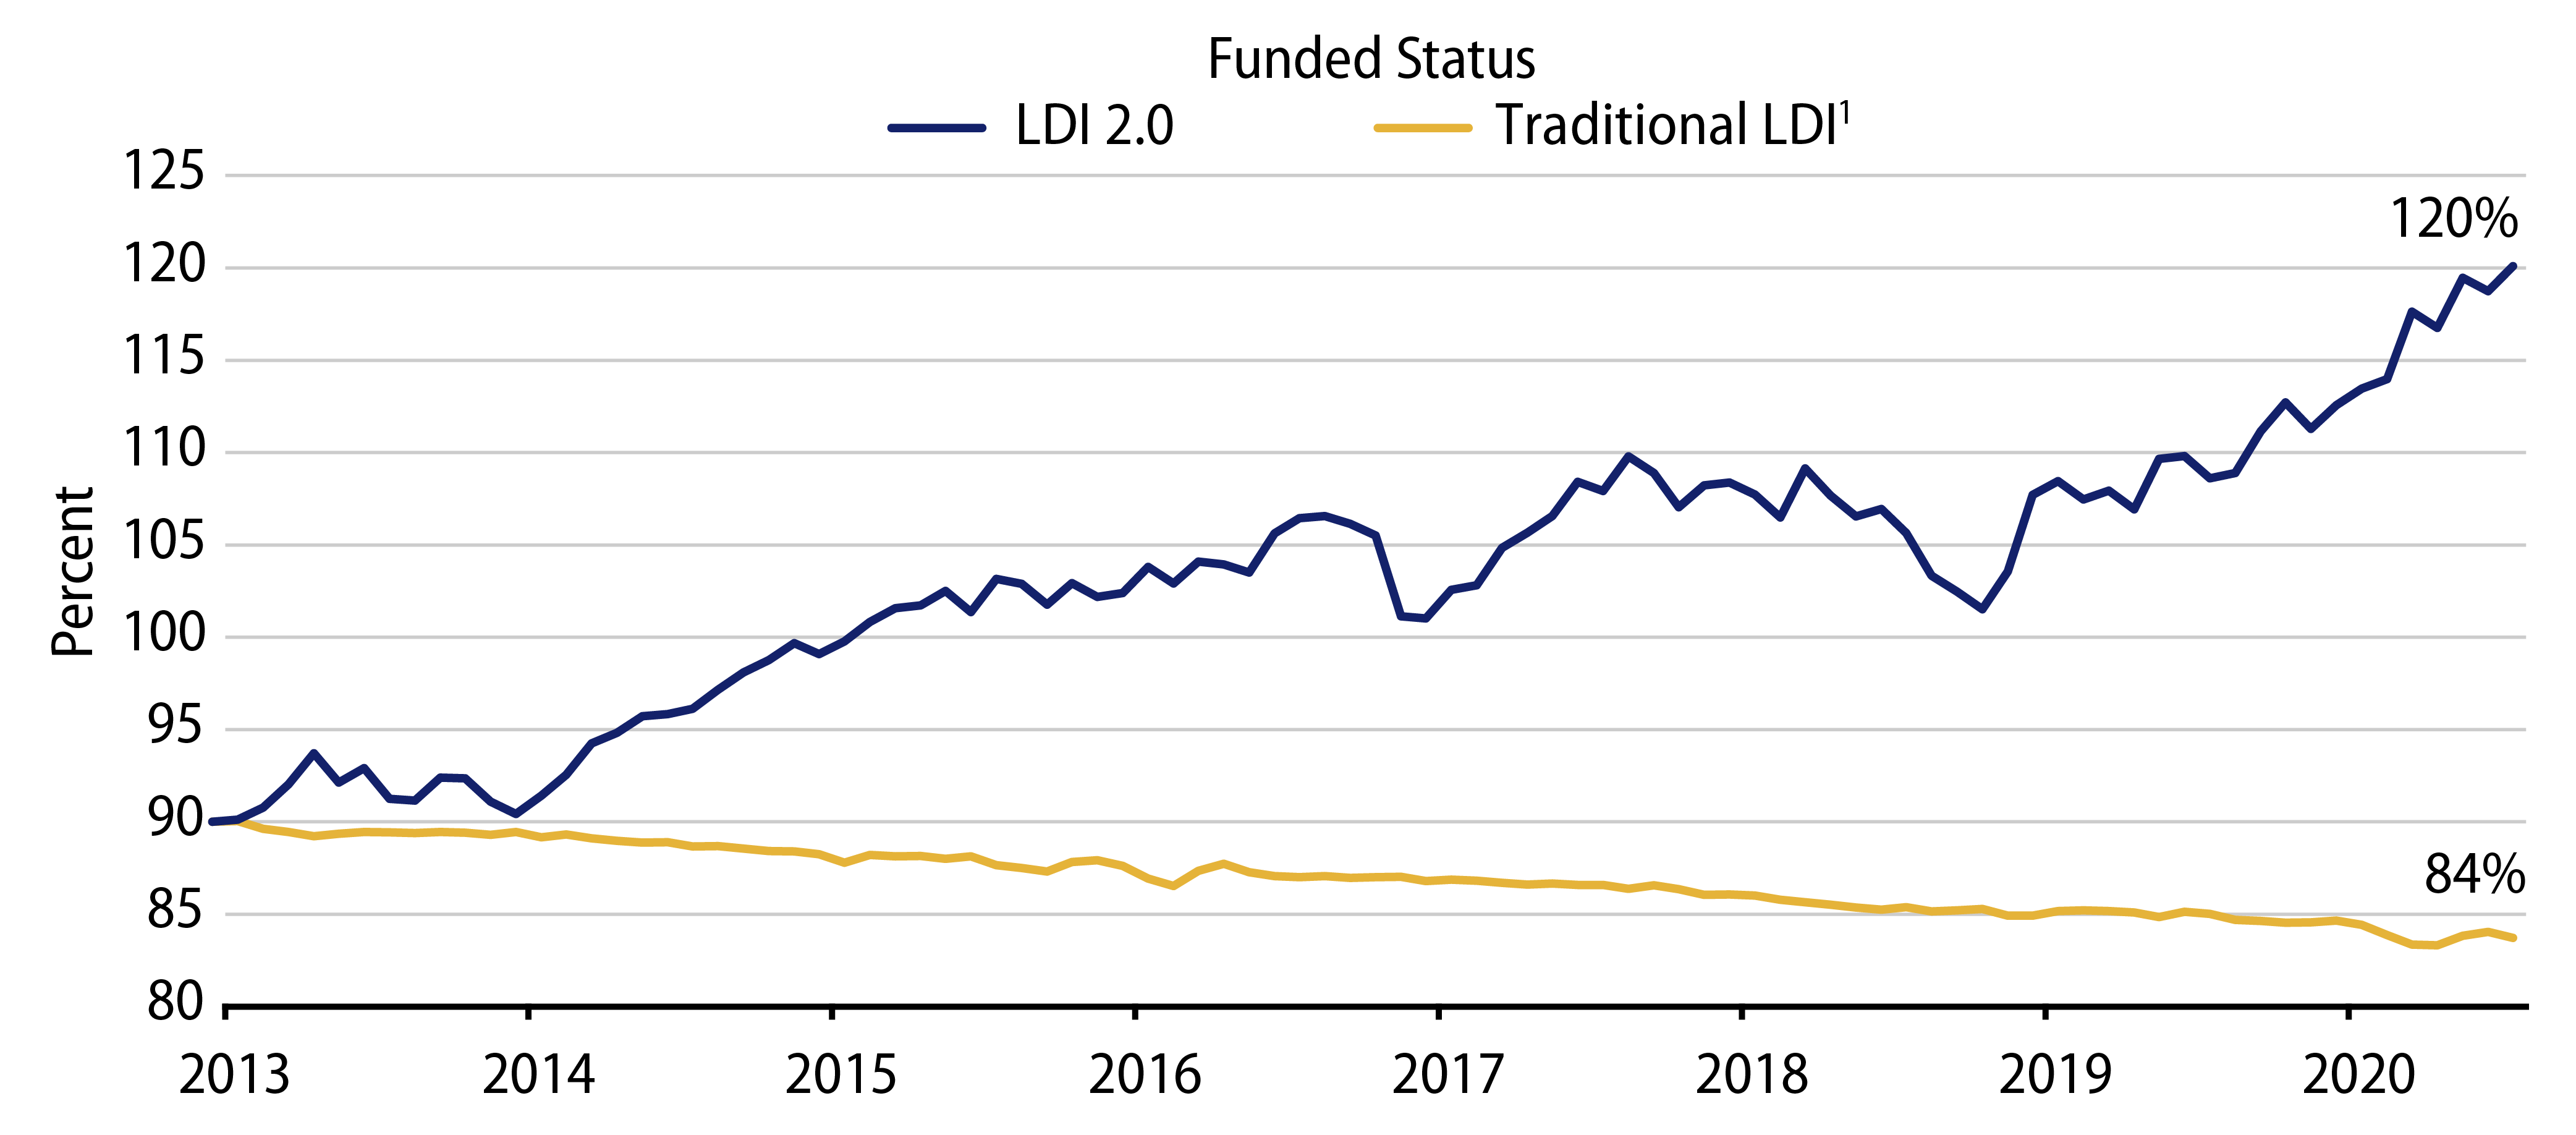
It is striking, however, to see how funded status would have progressed over time. In Exhibit 5, we assume the plan’s initial funded status is 90% and that liability payments are 5% per year. We utilize the same proxy liability benchmark as shown in Exhibit 3, adding 65 bps to returns to account for the boost to liabilities from negative credit events. Both of these headwinds help to illustrate the need for either additional alpha or additional contributions when adopting an LDI 1.0 approach. Without either, funded status will bleed over time.
The Bottom Line
While outside the traditional LDI box, LDI 2.0 solves for both the liability tracking requirement and the desire for higher return assumption objectives. The latter may help to minimize the effect on expected return on assets (EROA), a feature that is attractive for companies seeking to bolster the contra-pension expense. Furthermore, the returns generated by LDI 2.0 would have propelled funded status to well above fully funded, while the alpha pattern is also uncorrelated with a traditional approach. LDI 2.0 may therefore appeal to severely underfunded plans that seek returns, or to near fully funded plans looking to diversify the alpha pattern from a stable of traditional LDI managers.