In mid-March, the Treasury market went through a period of severe illiquidity. As we discussed in our webcast two weeks ago on the Fed’s role, illiquidity in the Treasury market was apparent in a number of ways: the elevated cost of transacting in Treasury bonds, the large difference in yields between on-the-run and off-the-run Treasury bonds, the very high day-to-day volatility in Treasuries, and the breakdown of normal correlations between Treasuries and other assets.
The bigger picture behind these dislocations was that the investors had been selling Treasuries to raise cash in their portfolios. The demand for cash was fueled by pervasive concerns about the macroeconomic outlook—obviously due to the COVID-19 pandemic but also the oil price rout—and a deep uncertainty about the implications for financial assets. Investors’ preference for cash over other financial assets is common in such environments. This time the demand for cash was system-wide, in that it affected investors across the globe and across asset classes, which in turn led to a truly astounding amount of Treasury sales. Why were investors selling Treasuries to raise cash? The simple answer is that investors tend to sell what they can to raise cash, which is often Treasuries because of the relative depth of that market.
As investors were selling Treasuries, dealers were forced to take the other side and become buyers of Treasuries. This resulted in a substantial amount of Treasuries building up on dealer balance sheets. In normal times this wouldn’t necessarily cause a problem, as dealers can use derivatives to hedge the risk related to holding Treasuries. That was not possible, however, because the illiquidity had affected the derivatives market, which was also experiencing distorted prices and very elevated volatility. Together with concerns about regulatory leverage ratios, the inability of dealers to hedge any further purchases contributed to exceptionally thin markets and the overall market illiquidity.
This centrality of US Treasuries to other markets and strategies makes illiquidity in the Treasury market particularly problematic. For example, many investors buy corporate bonds to capture the spread between corporates and US Treasuries. Any investment in this strategy requires buying corporates and simultaneously selling Treasury bonds. If the Treasury market doesn’t function, these types of strategies are no longer available, which in turn reduces participation in corporate markets.
This was the environment in the middle of March: large-scale cash raising led investors to sell Treasuries, which then accumulated on dealer balance sheets, which in turn became overwhelmed, causing further illiquidity in Treasury markets. Finally, because of the centrality of Treasuries to other markets, the illiquidity in Treasuries contributed to the distortions across risk markets as well.
Over the last two weeks the Fed has addressed this problem through a very aggressive and unprecedented amount of Treasury bond purchases, as well as agency MBS purchases. The program was initially announced as $700 billion of purchases, but merely a week later was expanded to purchases “as needed” to support market liquidity. Over the past week and a half the Fed has been purchasing $75 billion of Treasury securities on a daily basis. At this pace it will take less than two full weeks for the Fed to purchase more securities than it did during the entire QE2 program, which took over eight months to implement.
The Fed’s purpose in conducting such a massive purchase program is to provide cash to the end investors who are demanding it. Due to operating constraints, the Fed has to do this by buying Treasury bonds from dealers in exchange for cash, and the dealers in turn provide cash to investors in exchange for their Treasury bonds. It’s somewhat circuitous, but the Fed’s purchases do work and should, over time, both meet the financial system’s demand for cash and in doing so stabilize the Treasury market.
Our assessment is that the Fed programs are showing early signs of having the intended effect. In particular, the Treasury market is already starting to see some modest stabilization. However, while some markets have moved away from the extreme levels of a few weeks ago, there remain pockets of concern. One such area of concern continues to be the market for unsecured financing. The following charts provide visual evidence of the stabilization in the Treasury market, as well as the area that appears to be lagging.
Beginnings of Stabilization
The beginnings of stabilization in the Treasury market are encouraging. The Fed deserves credit for its central role in bringing this about. While the nature of the Fed’s response is classic central banking—providing liquidity in times of panic—the speed and scale of the response is notable. Finally, given the centrality of Treasury bonds to many different investment strategies, it is possible that the stabilization of the Treasury market can contribute to the healing process for other dislocated markets as well.
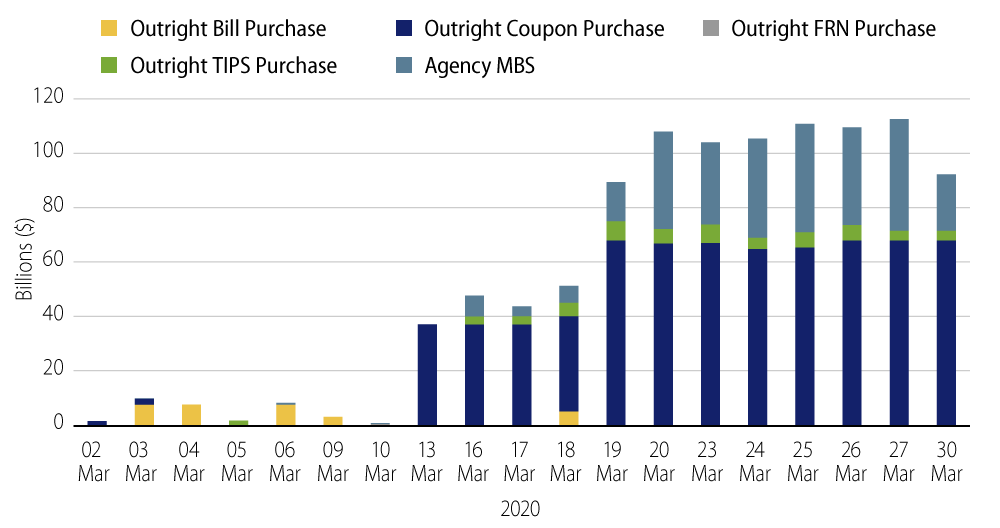
On Monday, March 23, the Fed announced that its purchases would be “in the amounts needed to support smooth market functioning and effective transmission of monetary policy to broader financial conditions.” Since then the Fed has been purchasing approximately $75 billion in Treasury notes and bonds and approximately $50 billion in agency MBS every day. Note that some of the agency MBS purchases have been replacing bonds that have pre-paid, so the net expansion of MBS on the Fed’s balance sheet has been somewhat smaller than the purchases alone would suggest. The language “in the amounts needed” underscores that there is no limit to the Fed’s purchases, meaning that purchases can continue at this pace for as long as necessary.
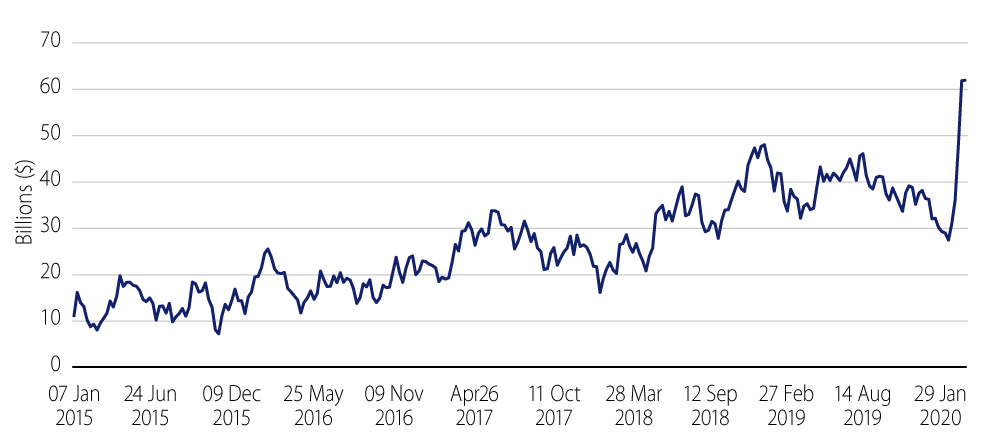
Recently primary dealers have accumulated large amounts of US Treasury securities as investors have been selling them to raise cash. These have become increasingly difficult for dealers to hedge, given dislocations in derivatives markets. Note that this data is released with a small lag, and is currently only available through March 18. Given the substantial Fed purchases, we expect the next release will show lower holdings in longer-term Treasuries.
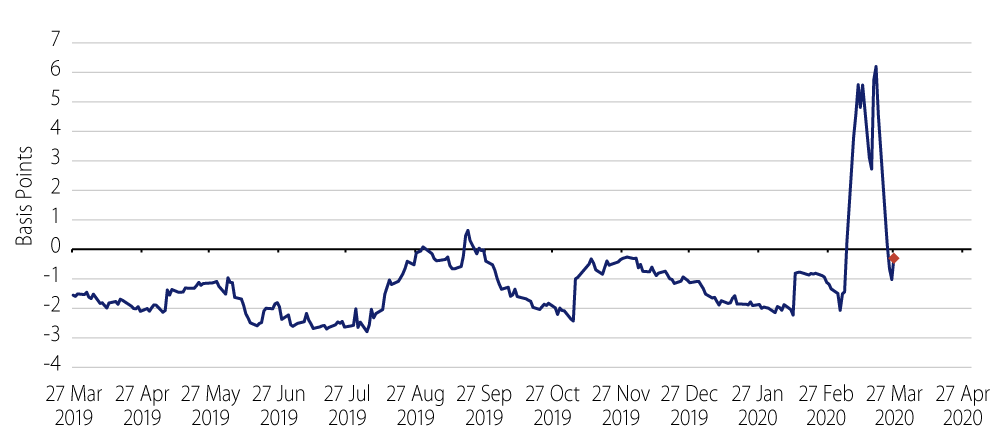
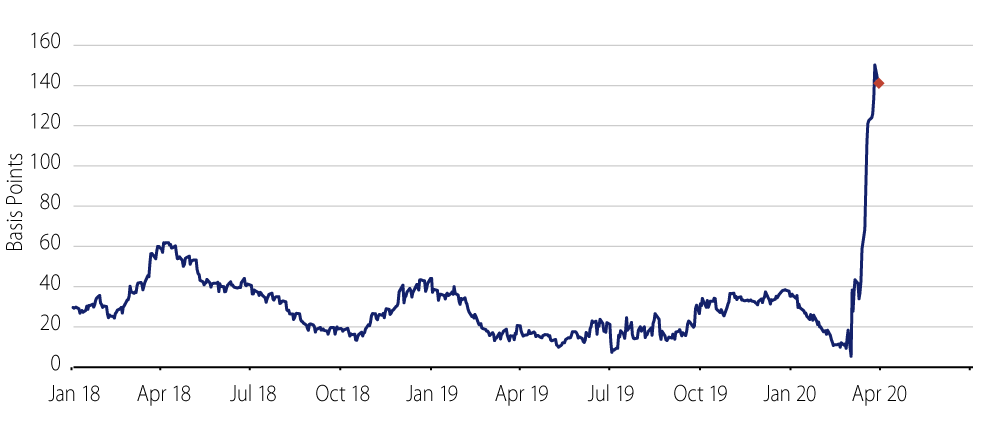
The difference between the yields of off-the-run and on-the-run Treasury securities is an indicator of the market’s capacity to bear risk, and in particular its capacity to bear risk in cash Treasury bonds. In normal times, there should be very little yield difference between the two bonds—they have the same structure, similar maturity and same underlying credit. However, in times of stress, especially when there is limited ability to hold cash securities, the difference can increase. The “Triple Old 10-year Treasury” is the 10-year Treasury bond that was issued three quarterly auction cycles previously. For example, right now the Triple Old 10-year Treasury is the Treasury bond that was issued in May of 2019.
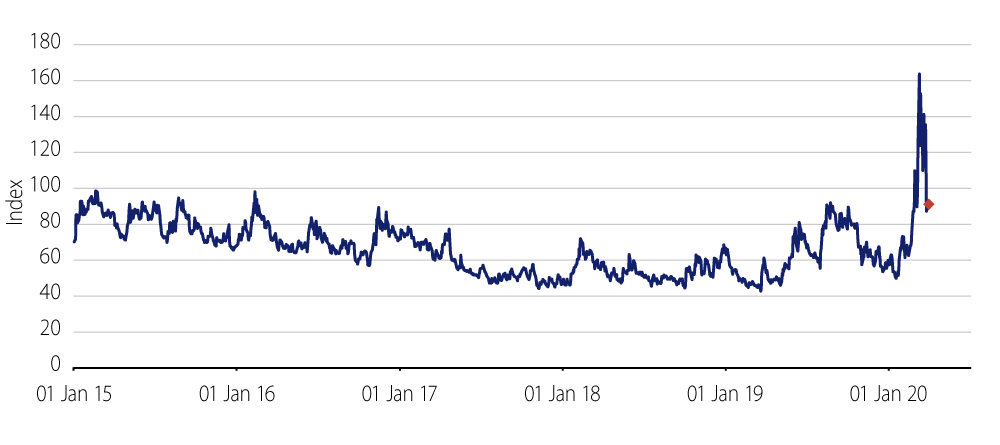
The MOVE Index is an indicator of implied volatility in the Treasury market. The MOVE Index is often described as being similar to the more familiar VIX Index, which is the implied volatility in the equities market. The MOVE Index is a weighted average of volatility in 2-, 5-, 10- and 30-year Treasury yields, with slightly more weight placed on the 10-year.
3-month LIBOR is the estimated cost for unsecured borrowing for a major bank. 3-month T-Bill yields are simply the yield on short-term US Treasury Bills. In normal times, banks borrow at a modestly higher rate than the US government does, due to the additional credit risk. The rate at which banks borrow can rise much higher in stressed times, however, due to a combination of heightened credit risk as well as dynamics in money market funds. Recently large outflows from prime money market funds, which led to concerns about prime funds hitting regulatory limits that may require gates, have led to a pull back from investments in commercial paper, which has in turn pressured bank borrowing costs higher. This is one area of the market that remains stressed.