
Concerns over soaring deficits, a surging public debt and a declining appetite for US Treasuries (USTs) continue to drive up long-term interest rates. But should we really be alarmed by these narratives? Let’s break them down.
Soaring Deficits and a Surging Public Debt
Over the past five decades, government deficits have often been cited as a worry for financial markets. When bond markets experience selloffs, government borrowing requirements are often pinpointed as a contributing factor. However, when other variables such as inflation and economic growth become more favorable for bond pricing, bond markets rebound, even though deficits and government borrowing needs remain significant. We would argue that government deficits and borrowing needs are not a reliable predictor of bond market strength or weakness. Consider the period going back to 2008: despite the global financial crisis (GFC) that year and the COVID-19 pandemic in 2020, which pushed deficit and debt levels to multi-decade highs, US interest rates continued to decline.
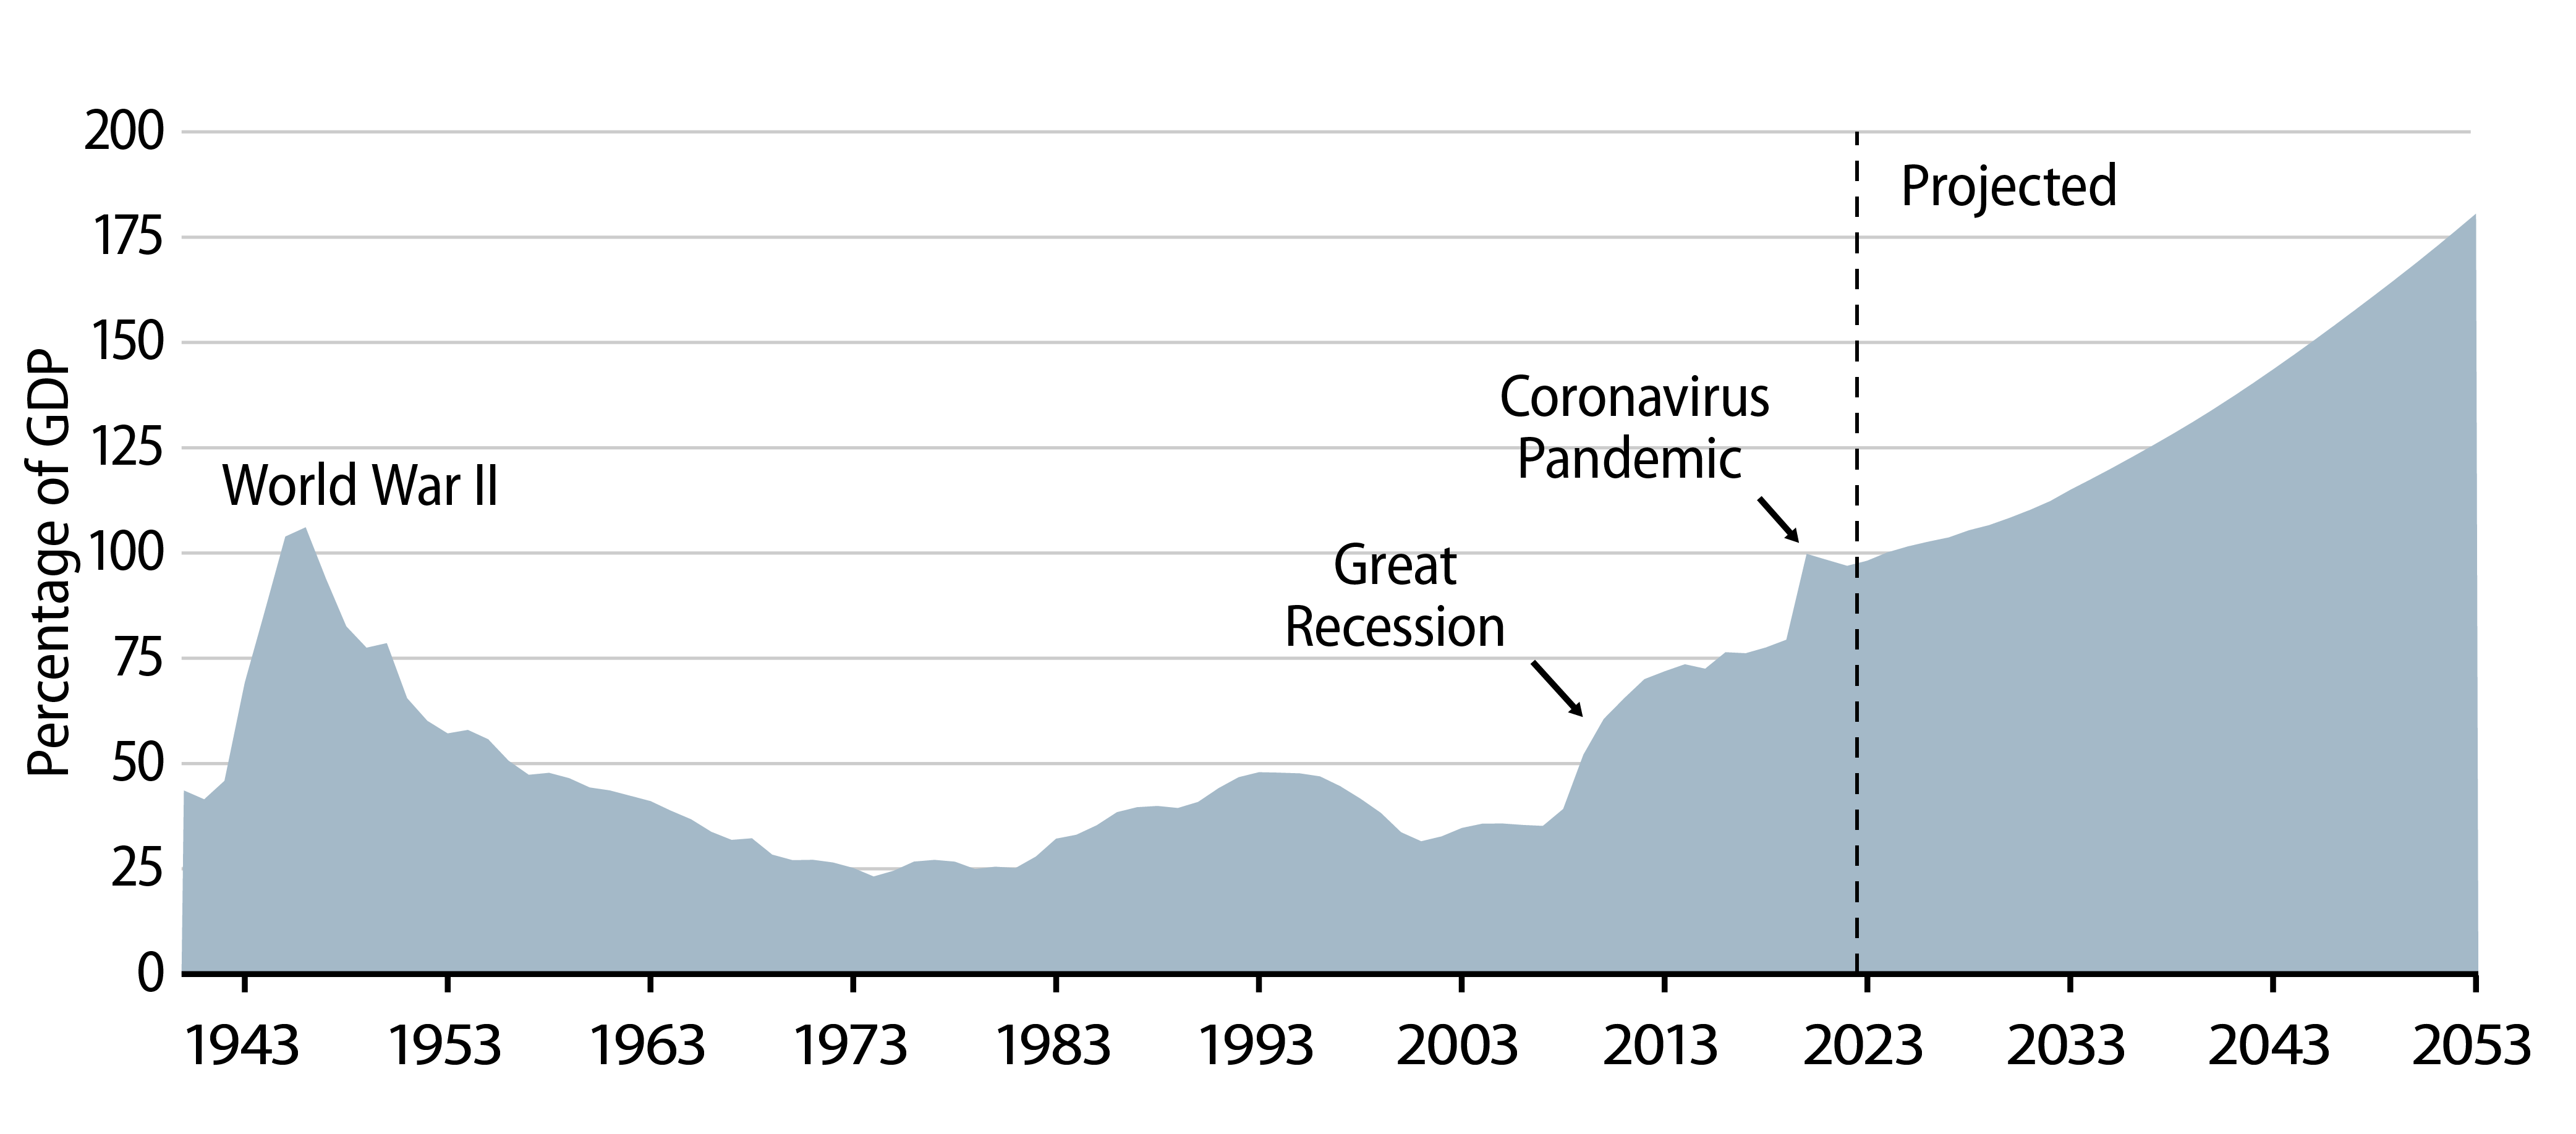
At the moment, the financial markets are unnerved. The ongoing disputes in the US Congress, creating uncertainty about future spending, along with the significant rise in UST yields, are amplifying concerns about impending debt servicing costs. These developments are further fueling anxieties around future deficit and debt levels. For instance, the Congressional Budget Office (CBO) warns that "if current laws generally remained unchanged," debt servicing costs (i.e., the net interest expense on public debt) could triple as a percentage of GDP and push the debt-to-GDP ratio to 181% by 2053, up from today’s 98% level.1
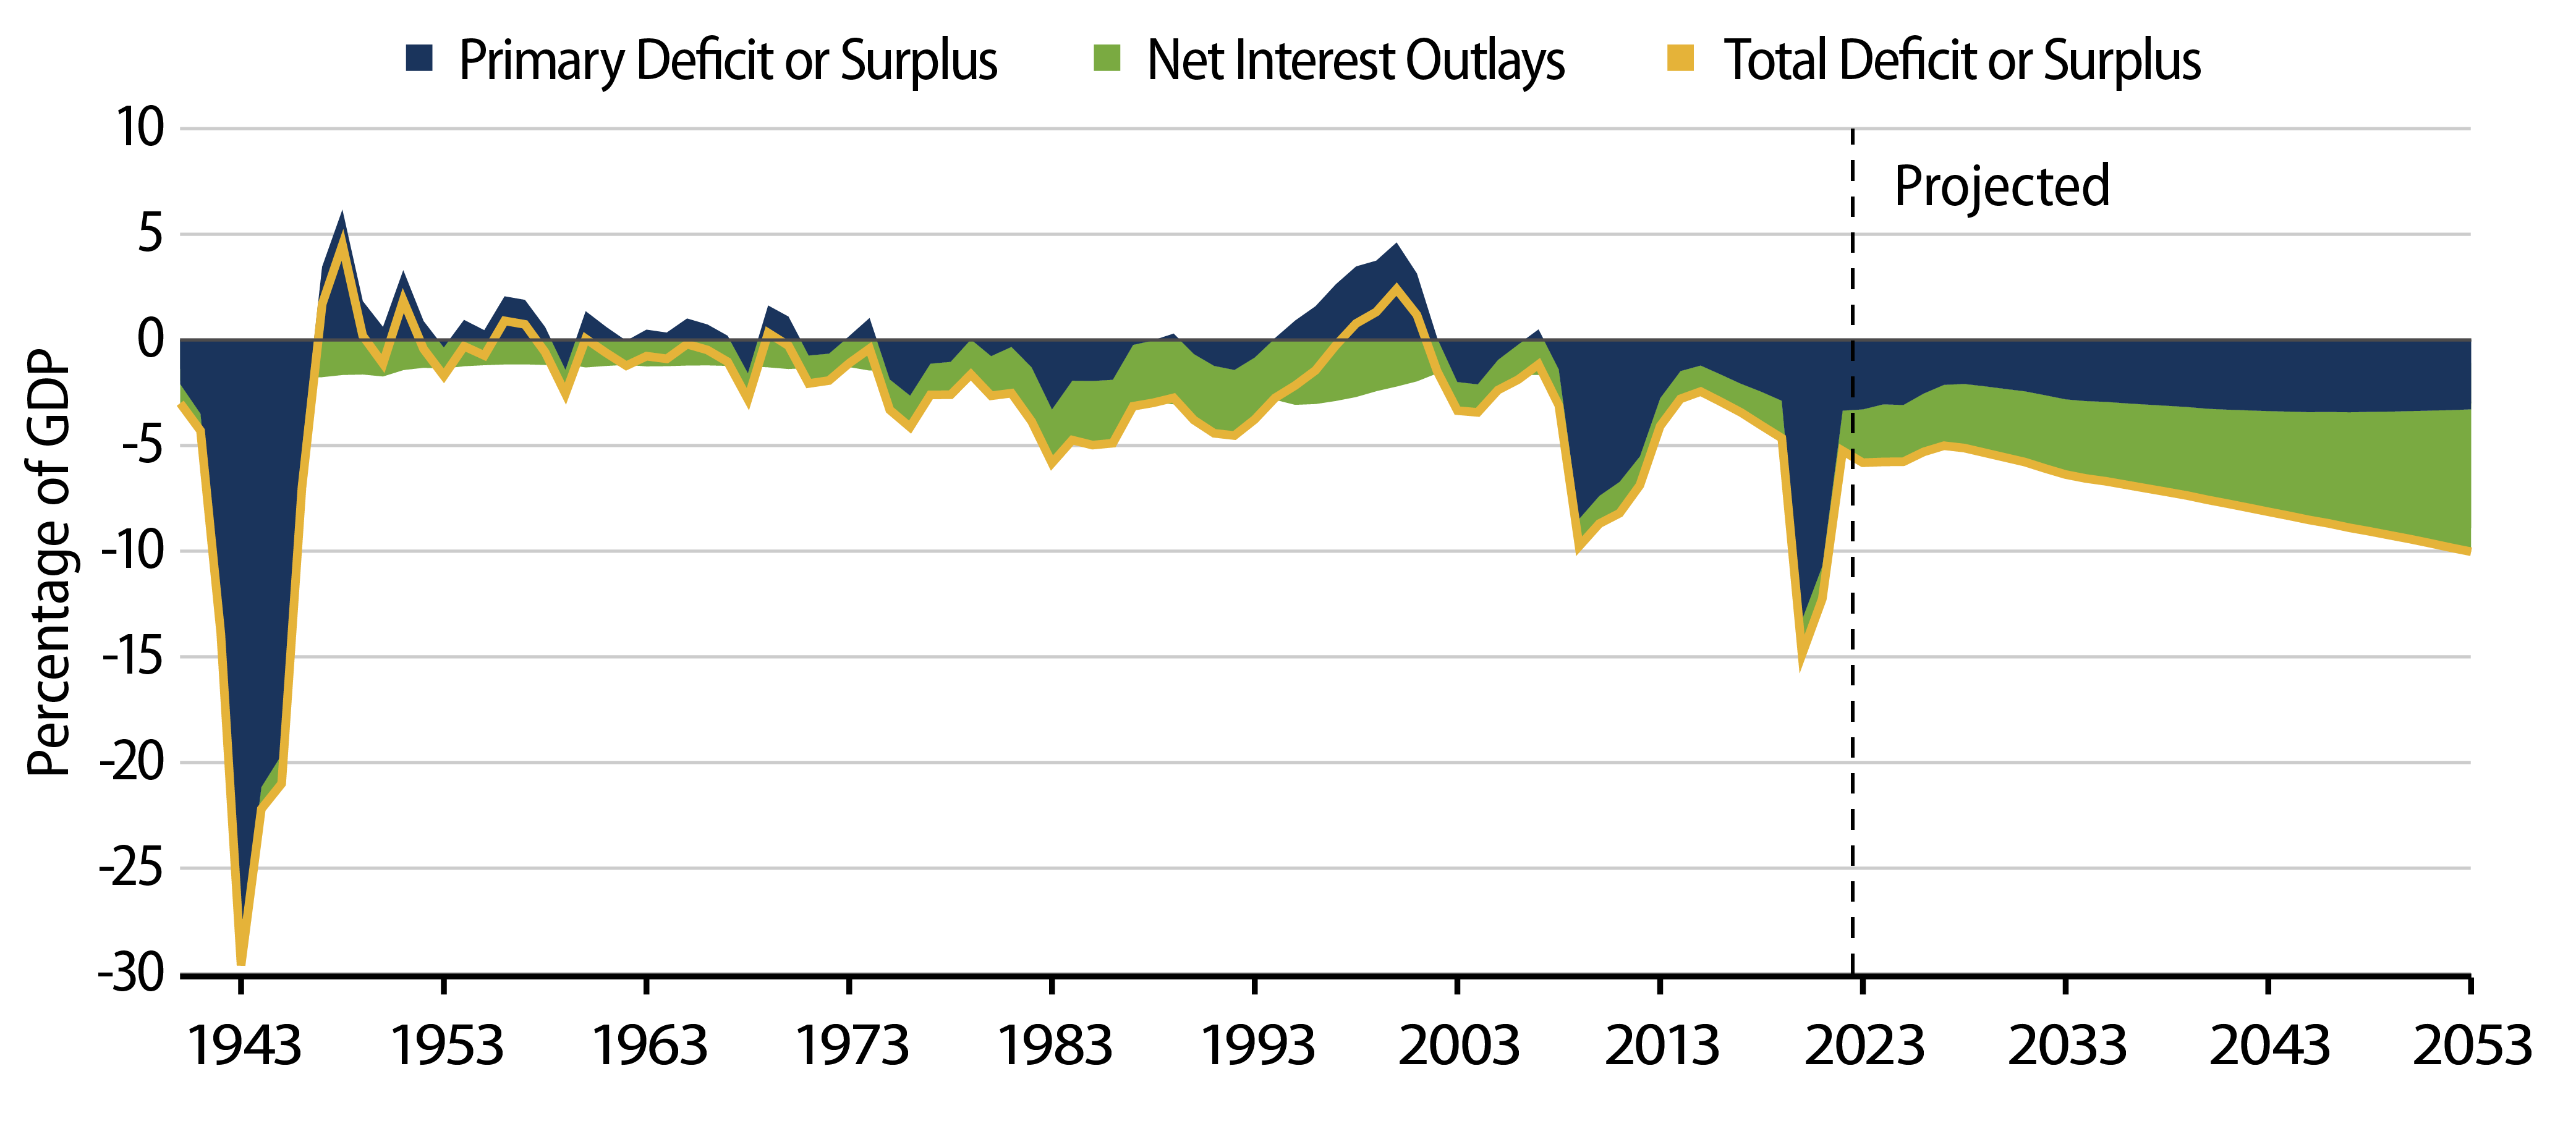
To put this ratio into perspective, consider that a person with an annual income of $50,000 and loans outstanding of $50,000 would have a personal debt-to-GDP ratio of 100%. While this might sound concerning, the crucial factor is not the ability to pay off the entire debt all at once, but whether the interest payments linked to that debt are affordable. If the interest rate on that debt is low and remains low, this individual could consider taking on more debt, particularly if they have job security and receive regular salary increases. In the case of the US, public debt has risen annually since the 2008 GFC with interest expense remaining stable due to low interest rates. However, the recent increase in interest rates is leading to a rise in interest expenses, sparking concerns in the market about the US government's capability to manage its growing debt burden.

At present, the average interest rate on US public debt is 2.7%. According to the US Congressional Budget Office (CBO), this rate is expected to average 3.4% over the next 30 years, which is a significant factor behind the projected tripling of the deficit. However, we believe such long-term interest-rate projections should be taken with a grain of salt as economic conditions, political dynamics and policies can change over time.
We would like to emphasize three key points:
First, long-term interest rates are heavily influenced by longer-term growth and inflation expectations. While the timing of the shift in Fed policy direction remains uncertain and months away, we don’t see medium- and long-dated bond yields remaining elevated for an extended period. Current market pricing on US interest rates has reached extremes, with long-term forward rates standing 150 bps above the Fed’s estimate of the neutral rate. Moreover, long-term real rates are hovering around 2.5%, significantly higher than the near-zero levels before the pandemic.
Second, long-term interest rates have moved higher since early August, mainly due to short-term influences—both the anticipation of increased UST supply (issued to cover one-off expenditures and declining capital gains revenues from 2022) and a surprising shift in Fed rhetoric regarding 2024 policy rates. We would add that although monetary policy is already restrictive, there’s the possibility that the Fed may hike one more time in the near term. However, if recession fears suddenly resurface due to an unforeseen external shock, the possibility of imminent rate cuts would immediately be back on the table. It's worth noting that over the past 30 years, the Fed has typically reduced rates approximately nine months after its last rate increase2 in a tightening cycle.
Last, it’s important to consider how long it might take for a higher level of interest rates to result in increased debt servicing costs, assuming rates remain elevated. During the past few years of low interest rates, the US Treasury extended the average maturity of its debt, securing favorable rates for an extended period. Currently, the average maturity stands at 73 months, which is 10 months longer than the 20-year historical average.3 This move has provided a buffer, allowing for a more gradual adjustment to higher interest rates and offering some stability amid evolving market conditions.
Waning Demand for USTs
A recent Bloomberg article pointed out that traditional, price-agnostic investors like foreign governments, US commercial banks and the Fed are reducing their holdings of USTs. In their place, hedge funds, mutual funds, insurers and pensions are becoming more active buyers of USTs.4 While these new buyers might be more inclined to demand a higher premium to finance US government spending, the key takeaway for us is that there are still buyers (Exhibit 4).
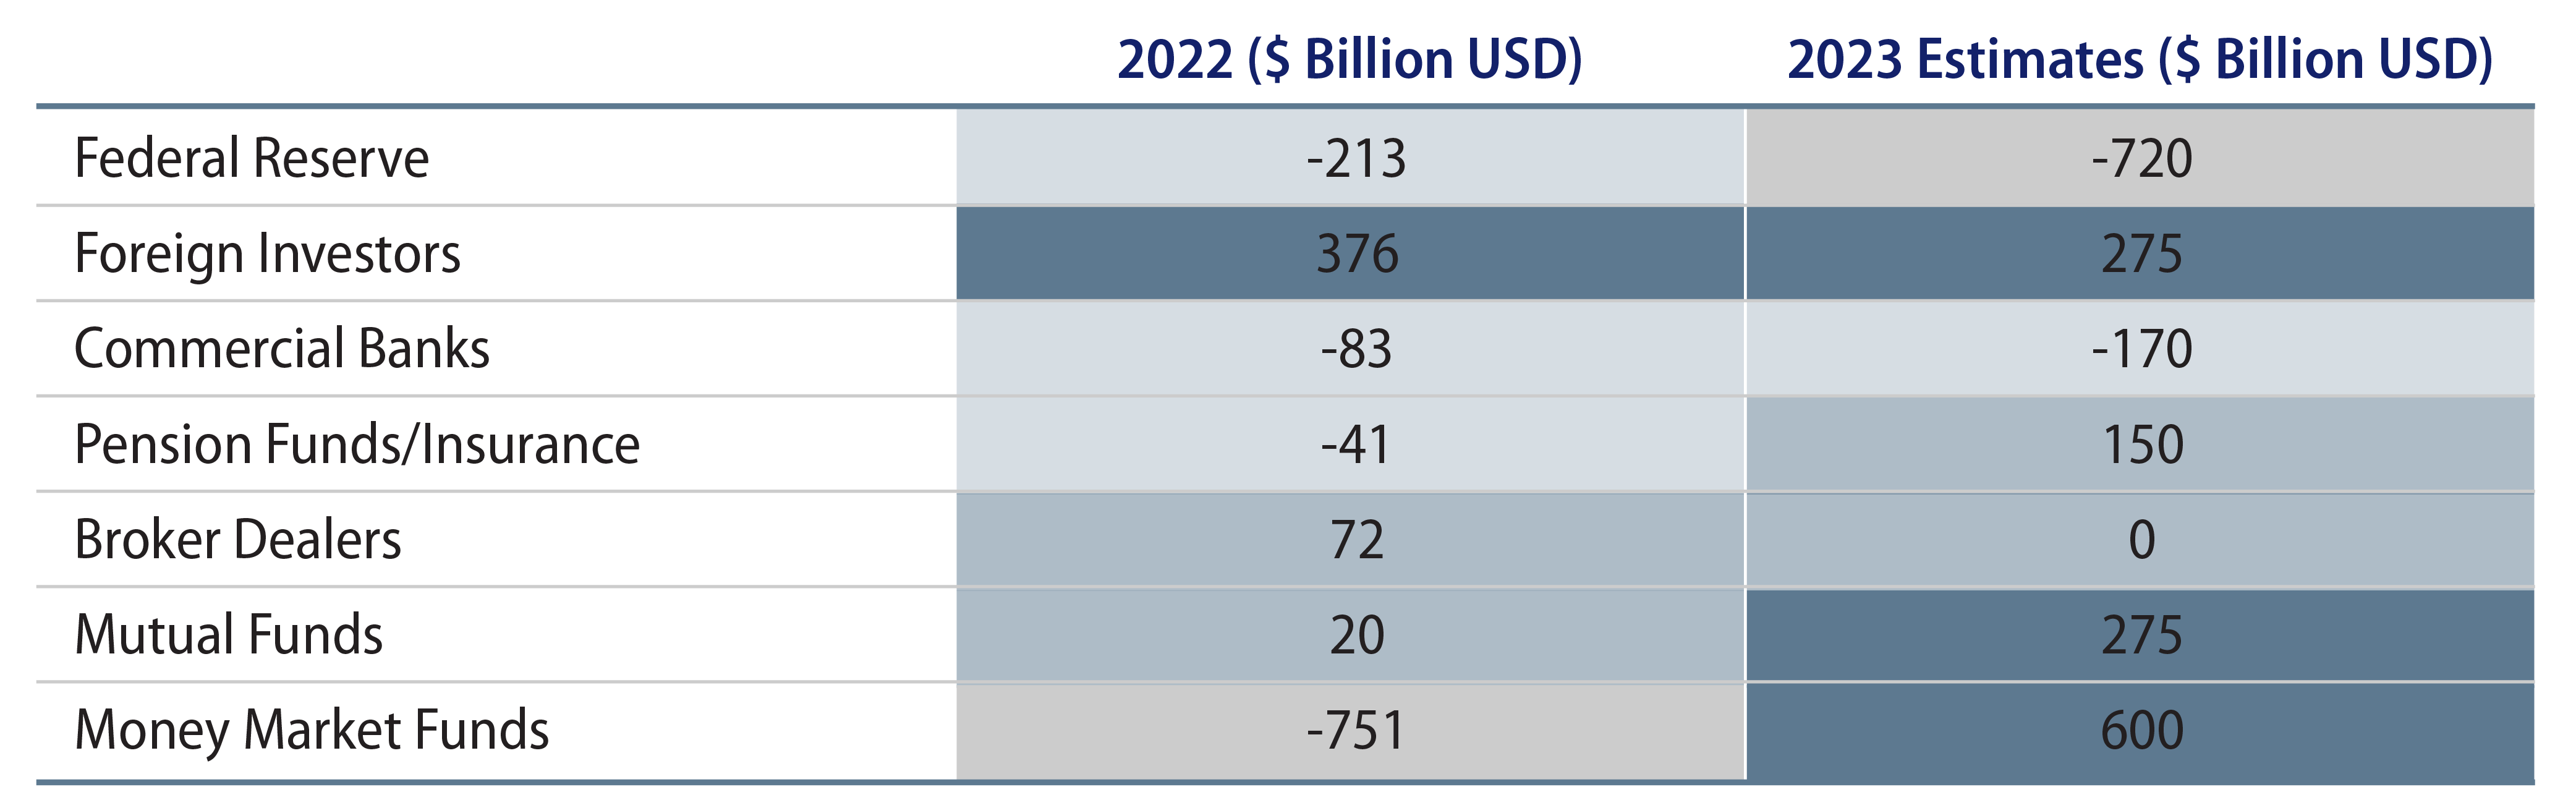
In our view, the absence of price-agnostic UST buyers in today's market doesn't mean they won't return—nor does this change imply a significant increase in the risk of the US encountering challenges in rolling over its debt or securing deficit financing, which are issues commonly faced by distressed emerging market (EM) countries. The US dollar’s status as the world’s reserve currency, facilitating easy borrowing for the US, and the recognition of USTs as the world's safe-haven asset, especially in times of escalating geopolitical tensions, should dispel any doubts about the economic or financial resilience of the US.5
In conclusion, the robust demand we’re currently seeing for shorter-dated securities, such as one-year US T-bills, makes sense. These securities carry limited duration risk and offer yields not witnessed since 2006. The message to investors is clear: bonds are back, and better than before.
ENDNOTES
1. As of September 30, 2023, the federal "debt held by the public" amounted to $26.3 trillion, roughly 98% of GDP. The commonly cited "public debt outstanding" of $33.2 trillion is often misleading as approximately $6.8 trillion of this total represents federal government debt held for accounting purposes.
2. "Last Fed hike tends to aid stocks, but some have doubts this time," Reuters, September 15, 2023.
3. US Department of the Treasury, Quarterly Refunding Data, 2023-3rd Quarter, July 2023.
4. "Beware the New Treasury Buyers Sparking Fear in World’s Largest Bond Market," Bloomberg, October 13, 2023.
5. "Exorbitant privilege," a term coined in the 1960s by Valery Giscard d’Estaing, refers to the benefits the US has due to its own currency and being the international reserve currency.