
Overall Score: B-
Trend: Stable
The US consumer score fell to a B- in the first quarter of 2026, while the quarterly trend remains stable. The labor market rebounded from softness earlier in the year and real spending improved from a weak Q4. Real income growth deteriorated further. Balance sheets, net worth and credit performance all remained strong, benefiting from a resilient consumer tied to strength in high-income households. However, consumer sentiment continues to remain weak, diverging between low-income and high-income households.
We view the US consumer as weaker now than at the beginning of the year. In addition to real income growth cooling, inflationary pressures due to higher energy prices more than offset the higher tax refund tailwind that has helped spending and consumer performance. We expect spending to soften in the upcoming quarter as inflationary pressures pinch consumers with less financial flexibility.
The current score of B- (62%) remains well above the average score of C+ (55%) seen from 2010 to 2019. The ongoing cooling from peak pandemic-era stimulus suggests the US economy is gradually returning to its longer-term trend.
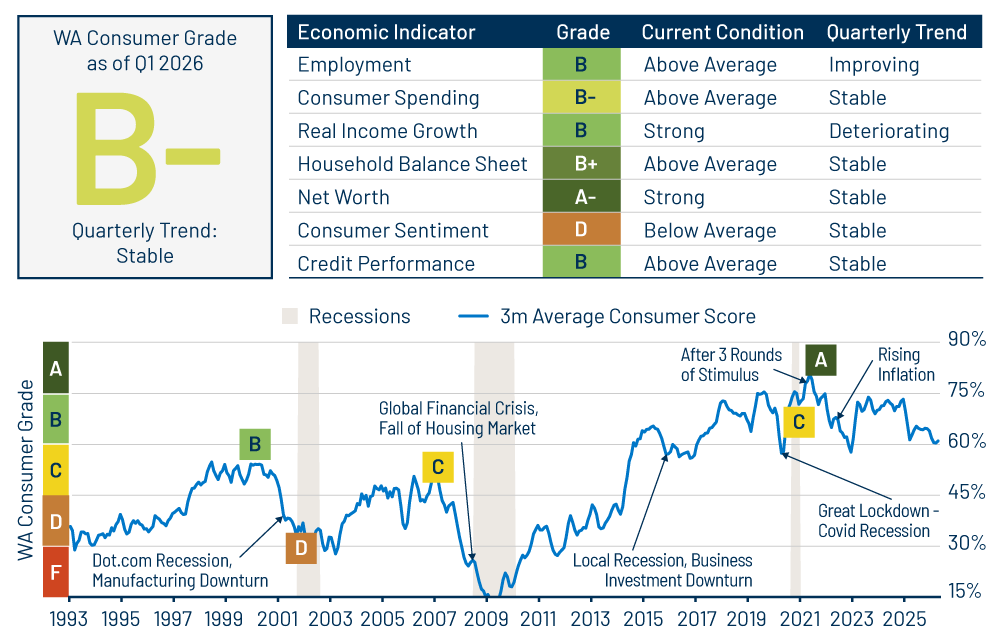
Employment: B
Trend: Improving
The labor market appears to have stabilized. Employment shows signs of resilience as the nonfarm payrolls report showed notable improvement in March and April coming in above expectations. The unemployment rate also fell to 4.3%, with little movement in hiring or the layoff rate. Looking ahead, risks are skewed toward further labor market weakening if higher energy prices weigh on consumer spending and overall growth.
Consumer Spending: B-
Trend: Stable
Real consumer spending grew at a moderate pace in March, improving 1Q26 results after a soft 4Q25. Real Personal Consumption Expenditures (PCE) growth saw a healthy increase of 2.1% year-over-year. Spending on gasoline saw a meaningful rise in March, weighing most on low- and middle-income households. Spending headwinds from higher inflation due to increased energy prices are expected to weigh on spending growth for the rest of the year.
Real Income Growth: B
Trend: Deteriorating
Real disposable income growth continued to decline in the first quarter and remains soft at 1.3%, on a 6-month annualized basis. The boost from higher tax refunds and lower tax payments from the One Big Beautiful Bill Act was offset by an increase in capital gains tax payments, resulting in a net limited boost to household income. Higher energy prices are expected to erode household spending power, especially among low-income households that spend a larger portion of their disposable income on energy expenses. Real income growth is expected to continue to be soft the rest of the year.
Household Balance Sheets: B+
Trend: Stable
Consumer credit rose modestly in Q1 at an annualized rate of 3.5%, offset by a seasonal decline in credit card balances. Household leverage and debt servicing costs as a percentage of disposable income increased a touch in late 2025 but remain low by historical standards. The lock-in effect of low mortgage rates on households continues to outpace the increased financing costs seen over the past few years.
Wealth/Net Worth: A-
Trend: Stable
The net worth to disposable personal income ratio remains near all-time highs. Although equity valuations fell in the first quarter, they rebounded in April. Higher net worth households continue to reflect most of the gains. The savings rate dropped to 3.6% in March, led by a spike in energy prices, which is the lowest level since 2022. Liquid deposits have increased across income cohorts for most of 2025 and remain elevated in 1Q26 relative to pre-pandemic levels.
Consumer Sentiment: D
Trend: Stable
The University of Michigan and Conference Board Consumer sentiment indices both declined further in Q1 led by middle- and low-income households expressing concern about rising gas prices. The sentiment index scores rose for higher-income households, reflecting a rise in stock prices. Both surveys hover close to post-Covid lows and are expected to remain volatile.
Credit Performance: B
Trend: Stable
Credit card performance has been stable for the past three quarters, which is an indicator of higher-income consumers supporting credit card spending. However, it also masks weaker trends among households with less financial flexibility. Moreover, lower-income consumers may be relying on credit card alternatives such as buy-now-pay-later (BNPL) services as surveys show more consumers now rely on BNPL for everyday purchases.
Higher energy prices have dampened the impact of higher tax refunds on consumer performance, which was initially expected to reverse some of the deterioration seen in 2025. Non-prime auto loans have seen a very minor seasonal improvement in performance, which is likely to reverse in upcoming months. The prime consumer has shown a bit more improvement, as seen in the performance of prime auto loans. Federal student loan delinquencies improved from 4Q25 but remain slightly more elevated than pre-pandemic. Wage garnishment for loans in default will resume in the summer and could impact credit scores, whereas the impact on other credit products remains to be seen.
We continue to favor focusing on high-quality consumer credit, such as prime auto and private student loans as well as consumer sectors related to housing. In addition, we lean toward positions higher up in the capital structure, and we remain cautious about subprime consumer assets.
Background on Methodology
Our methodology rationale for creating the US Consumer Report Card first involves ranking economic indicators versus a historical dataset, with tracked periodic changes going back to 1990. We then calculate a weighted average score for each month. Assigned weights range from a high of 23% to a low of 10%. Employment, consumer spending and real income growth make up 60%, while the remaining indicators comprise 40%. The consumer score is mapped against letter grades, normalized for historical experience.