
Overall Score: B
Trend: Stable
We assign the US consumer a strong grade of B entering third quarter, but with a negative outlook. In Q2, the US consumer showed signs of further cooling in the labor market and softer spending, while other metrics remained stable. Consumer sentiment is still hovering near recent lows, reflecting uncertainty about the impact of inflation and tariffs on US consumers. The ongoing cooling from peak pandemic-era stimulus suggests the economy is gradually returning to its longer-term trend. The current score of B (66%) remains well above the average score of C+ (55%) seen from 2010 to 2019. We expect further deterioration in economic indicators over the next few quarters given the challenging macroeconomic backdrop due to tariff uncertainty along with higher inflation putting further pressure on US consumers’ health.
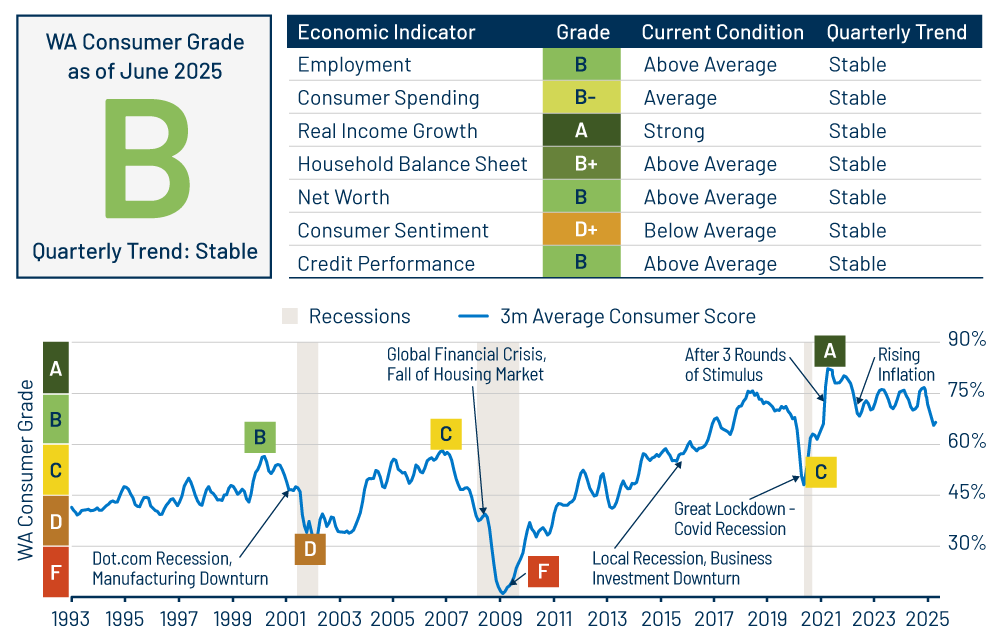
Employment: B
Trend: Stable
The unemployment rate for June declined to 4.1% but went back up to 4.2% in July, rising 0.2% from January. Looking beyond the headline figure, the labor market remains weak. Job growth slowed and nonfarm payrolls saw sharp downward revisions to May and June. We expect further pressure in the labor market due to a slowdown in immigration and government hiring, which will likely affect payroll growth.
Consumer Spending: B-
Trend: Stable
Real consumer spending growth continues to slow from last year’s strong increases of around 3%. Second quarter spending rebounded from a weak first quarter but remains below 2024 levels. We expect spending to slow meaningfully in 2H25 as tariff inflation weighs on consumer purchasing power and slowing job growth leads to lower compensation. Goods spending is expected to slow more significantly, as goods are most affected by rising prices from tariffs. The recent fiscal policy should help consumers on the margin in 2026, but that improvement is likely to be offset by the impact of trade and immigration policy.
Real Income Growth: A
Trend: Stable
Real disposable income growth remained stable, hovering just over 2% in Q2, coming down from a 3.5% average last year. The middle-income cohort, mostly manufacturing, had the weakest employment growth but wages have held up. Wage growth was weakest for the lowest income cohort and just outpaced inflation. As labor demand continues to slow and inflation accelerates in the upcoming quarter, we could see a sharper decline in real income growth.
Household Balance Sheets: B+
Trend: Stable
Consumer credit grew at an annualized rate of 0.50% year-over-year in Q2. Revolving debt declined in Q1 on an annualized basis, and fixed-rate debt showed light annual gains. Household leverage and debt servicing costs remain low by historical standards, even though bifurcation between higher-income and lower-income consumers persists. A subset of consumers that has taken out debt in the past three years shows signs of increased leverage and weaker performance.
Wealth/Net Worth: B
Trend: Stable
Consumer net worth rebounded from a weaker Q1 and continues to build, contributing to strong consumer spending. Liquid assets continue to grow. The savings rate ticked up to 4.5% in June, staying flat from March, in line with 2023 and 2024. Consumers have been spending down their “excess savings” accumulated around the time of the pandemic, even though the pace of the drawdown has slowed.
Consumer Sentiment: D+
Trend: Stable
Both the University of Michigan and the Conference Board consumer sentiment figures reversed some of the decline seen early in the year. However, both surveys still hovered close to year-to-date lows as employment expectations continued to weaken. Consumer sentiment is expected to remain volatile over the next few months.
Credit Performance: B
Trend: Stable
Credit card 30+ days delinquency rates declined in the second quarter, as both new and seriously delinquent balances fell further from March. US consumer new credit card originations slowed further in Q2, reflecting further cautious spending trends. In contrast, delinquencies are rising for federal student loans and auto loans. Auto loan delinquencies across the credit spectrum have worsened for three consecutive months although they were expected to improve in Q2. In addition, lending standards for auto loans eased in Q1, which can potentially weigh on future delinquencies. Private student loans show just marginal deterioration in performance.
Delinquencies on federal student loans reached 10.2%, now back to pre-pandemic levels. Affected borrowers are now burdened with higher debt levels after payments resumed late last year. This is expected to have some spillover effect for consumers that hold other debt such as private student loans, auto loans and consumer loans. We have already seen some credit deterioration in underlying subprime consumer asset-backed securities (ABS) collateral. Further weakening in the labor market is expected to put increased pressure on consumer delinquency rates.
In this environment, we strongly favor focusing on high-quality consumer credit such as prime auto, private student loans and housing-related consumer sectors. In addition, we lean toward positions higher up in the capital structure, and we remain cautious around subprime consumer assets.
Background on Methodology
Our methodology rationale for creating the US Consumer Report Card first involves ranking economic indicators versus a historical dataset, with tracked periodic changes going back to 1990. We then calculate a weighted average score for each month. Assigned weights range from a high of 23% to a low of 10%. Employment, consumer spending and real income growth make up 60%, while the remaining indicators comprise 40%. The consumer score is mapped against letter grades, normalized for historical experience.