
Overall Score: B+
Trend: Stable
Our outlook for the US consumer has improved since last quarter based on better labor market data and strong real spending. As a result, the third quarter Western Asset Consumer Report Card grade was elevated to B+ from B in the second quarter. Although the recent positive consumer trend has been cooling from exceptionally strong readings during the time of peak stimulus during the pandemic, the current score of B+ (72%) is well above the average score of C+ (55%) seen from 2010 to 2019.
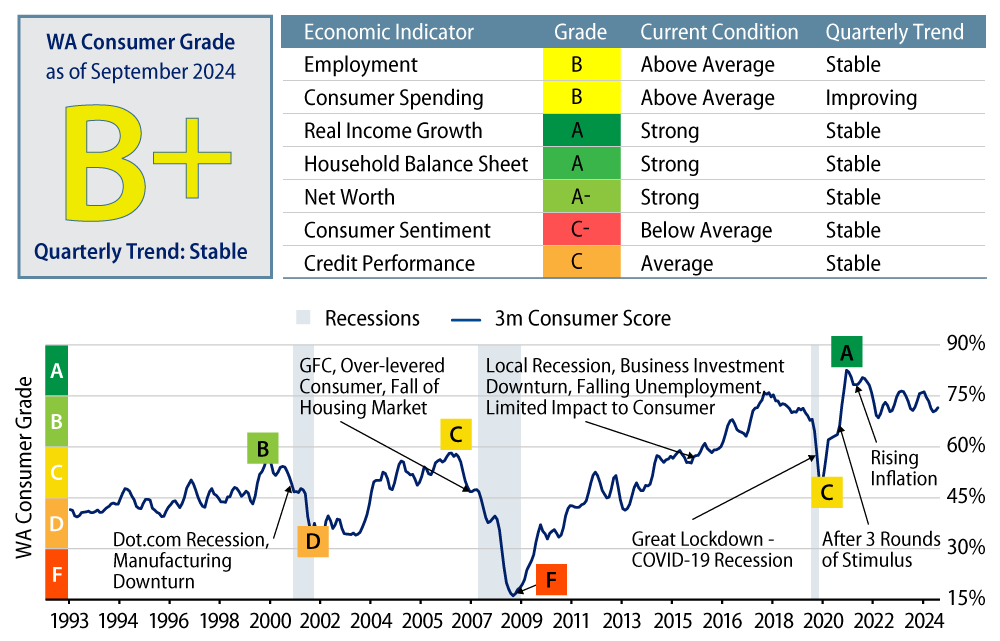
Employment: B
Trend: Stable
The September employment report showed improvement from both July and August, as the unemployment rate declined to 4.1% and alleviated some concerns. Nonfarm payrolls were elevated and job gains in prior months were revised up. Job growth estimates also improved from last quarter. Job openings remain elevated relative to pre-pandemic levels, but the hiring rate is lower than it has been during the past decade, reflecting a weak labor market. The quits rate fell further, now at 1.9%, signaling that fewer people are willing to switch jobs.
Consumer Spending: B
Trend: Improving
Real consumer spending increased in August by 2.6% year-over-year (YoY). Recent data has signaled strong spending growth as nominal retail sales rose by 0.4% in September and core retail sales rose by 0.5% in real terms. The US consumer continues to be a source of strength.
Real Income Growth: A
Trend: Stable
Real disposable income growth increased 3.1% YoY for August, after being revised up meaningfully last month, reflecting stronger gains in employee compensation in prior months. Strength in real wage growth was seen across all consumer income quartiles. September growth in real wages remains above the long-term trend of 2.75% (annualized), even though wages are in a declining trend from 2023 highs.
Household Balance Sheets: A
Trend: Stable
The rate of growth in consumer credit picked up to 2.3% YoY (annualized), led by growth in fixed-rate debt, but continues to be below long-term trends. Household leverage and debt servicing costs remain low by historical standards despite high consumer financing rates.
Wealth/Net Worth: A-
Trend: Stable
Aggregate household balance sheets have strengthened due to asset price increases. The net worth to disposable personal income ratio remains close to the all-time high. The wealth and savings fundamentals are stronger than they were in Q2. The savings rate was revised up to 5.2% in July following upward revisions to income, proving to be much stronger than previously thought, and much closer to the 6% to 7% range experienced prior to the pandemic. The savings rate then fell to 4.8% in August. The higher revision also boosted excess household savings by 200% to 300%, which we believe is sufficient to sustain the current rate of consumer spending for another couple of years.
Consumer Sentiment: C-
Trend: Stable
In recent months, both University of Michigan and Conference Board consumer indices were on an upward trend. This positive movement suggests that the start of the rate-cut cycle is likely to ease the burden on consumers. Consequently, we expect consumer spending to remain robust.
Credit Performance: C
Trend: Stable
Commercial bank credit card delinquencies continued to rise in the third quarter. Credit performance deteriorated at a slower pace than in prior quarters, indicating that tighter lending standards are having the desired impact. Credit card charge-offs have leveled off, and auto loan delinquency rates ticked down in September. However, we expect delinquency rates to continue to rise modestly.
Credit lending standards tightened further in the third quarter and remain tight for consumer loans in general. September and October saw a slowdown in consumer lending and borrowing, as the Fed’s September rate cut has yet to translate to easier lending conditions. 2023 and 2024 vintage consumer loans are performing better than the 2022 cohort thanks to tighter lending standards, therefore moderating the weakness in consumer credit.
The end of the payment ramp for federal student loan borrowers, which occurred in September, along with repayment plans being challenged in court, may exert financial pressure on select lower-income consumer cohorts as they resume their payment schedule early next year. We expect moderate weakness in Federal Family Education Loan (FFEL) Program and select private student loan asset-backed securities (ABS) performance.
The US consumer remains a source of strength and significant deterioration would be required to return to historical averages. In this environment, we favor investing in high-quality consumer credit, including private student loans, housing-related sectors such as solar ABS and prime auto loans.
Background on Methodology
Our methodology rationale for creating the US Consumer Report Card first involves ranking economic indicators versus a historical dataset, with tracked periodic changes going back to 1990. We then calculate a weighted average score for each month. Assigned weights range from 24% at the highest to 10% at the lowest. Employment, consumer spending and real income growth make up 40%, while remaining indicators comprise 60%. The consumer score is mapped against letter grades, normalized for historical experience.