
Private-sector payroll jobs rose by a relatively hefty 172,000 in January, according to data released today by the Bureau of Labor Statistics (BLS). However, it continued to be the case that the bulk of these jobs gains, 137,000 in January, occurred within the industry sectors of health care and social services.
Meanwhile, BLS released benchmark revisions to the payroll data today, substantially changing the payroll data from 2021 onward. These revisions confirmed one point we have been making, and they also shed light on another point we’ve mentioned. First, we had suggested that the current torpor in job growth has actually been in place since mid-2023. The revised data support this contention even more clearly.
Second, in our last post, we pointed out that the US manufacturing sector had picked up substantially since late-2024, but that there was no “echo” of this in the payroll data. Well, the revised data now show an increase in factory production hours worked since late-2024. Factories are still shedding workers in total, but not as rapidly as in 2024; in 2025 increases in average workweeks were sufficient to more than offset the job losses. Details on all these points follow, but first a “housekeeping” item.
The second government shutdown of this fiscal year ended last week. Today’s payroll report and revisions were originally scheduled for last Friday, but were delayed three days by that shutdown. BLS was supposed to release January Consumer Price Index data today, but the shutdown delayed that release until this Friday (which we will cover in our next blog post). At that point, BLS will be essentially fully recovered from shutdown delays in its data reporting. Meanwhile, the Census Bureau is still reporting data from December and won’t be fully back on schedule until March or April. Ditto with the Bureau of Economic Analysis, which will release 4Q GDP data on Friday, February 20, nearly a month behind schedule.
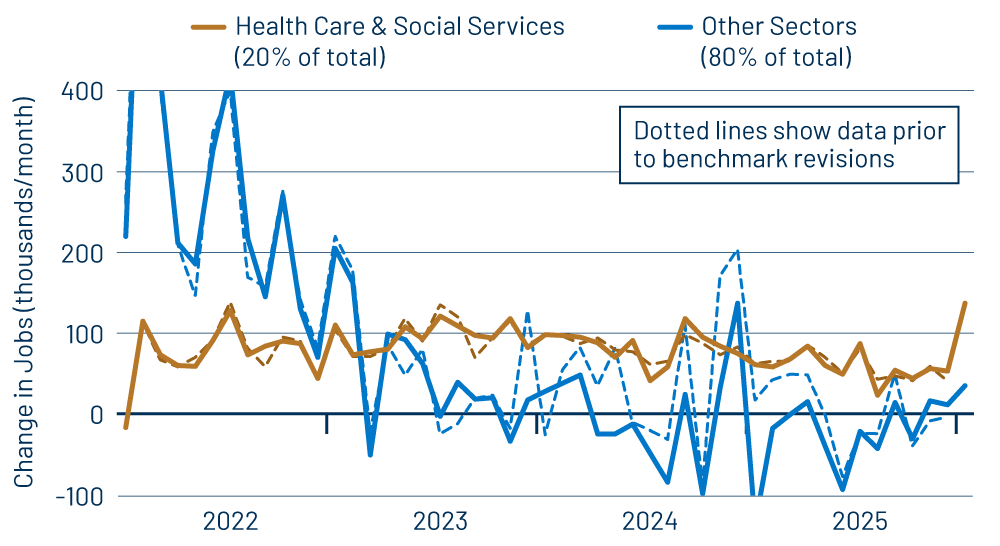
Exhibit 1 shows our typical dichotomy of private-sector payroll jobs along with both pre- and post-benchmark-revision data. The dotted lines depict how the data looked prior to the revisions, as of our January 9 post. Again, outside health care and social services, job growth had been gyrating around zero since mid-2023, but with a brief flurry from December 2023 through December 2024. As we expected, the new benchmarks mostly revised away that flurry, and they show clearly that job growth has been going nowhere since July 2024—except in health care and social services.
Those latter sectors account for only 20% of private-sector payroll jobs, but they have been accounting for essentially all private-sector job growth: a 2.12 million gain in health and social services since July 2023, compared to a 0.234 million net gain for the rest of the private sector since that date.
As for the benchmark jobs revisions, they were mostly in trade and logistics (-309,000), leisure & hospitality (mostly restaurants) (-153,000), professional business services (-126,000) and manufacturing (-98,000), out of a total revision of -864,000 to private-sector jobs. These revisions are as of the new March 2025 benchmark date.
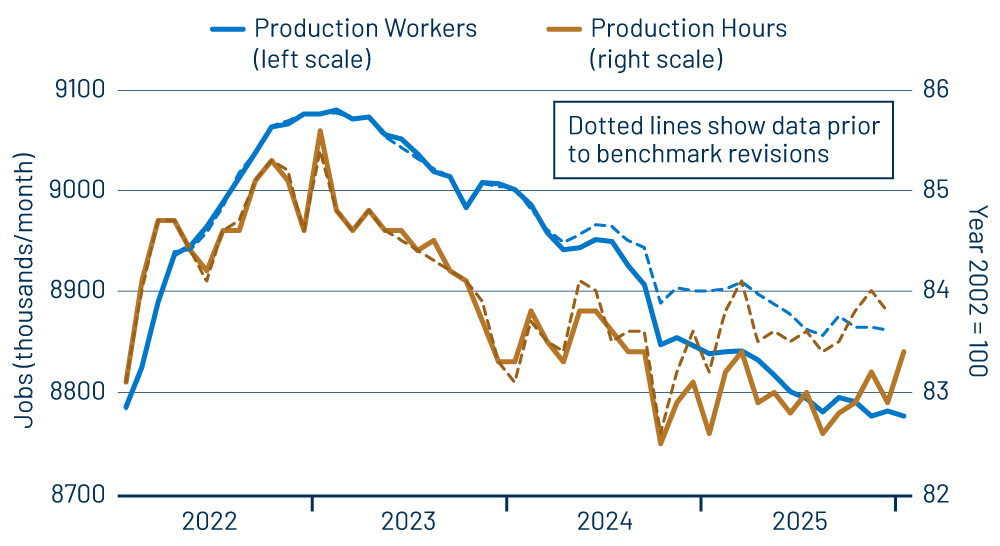
The revisions to manufacturing actually reflect a net improvement. As seen in Exhibit 2, factory job losses now look milder in 2025 than in 2024. Factory production worker jobs declined by “only” -64,000 in 2025, compared to a -161,000 decline in 2024. Combined with an increase in average workweeks, total production hours now look to be increasing modestly since October 2024. Pre-revision data had shown essentially flat production hours, though at a higher level than current data. In other words, the factory sector shed jobs and production hours especially sharply in Fall 2024, but has been recovering modestly—in production hours, at least—since late-2024. This lines up with factory production and orders/shipment data, which also show an improvement since late-2024.
While it is true that manufacturing has held a declining share of total employment for the last 50 years, its share of total GDP has held relatively steady, and it still provides the main source of cyclical fluctuation in the overall economy. So, the improvement in manufacturing activity over the last year plus is noteworthy.
In terms of the January data alone, last month’s gain in private-sector jobs was the sharpest in quite a while, but the bulk of that “strength” was, again, in health care and social services, two sectors that mostly reflect government activity. Average workweeks have ticked up over the last three months, leading to some pick-up in production hours worked. We’ll see if that translates into better job growth going forward.
Over the last six months, average hourly wages have grown at an average annualized rate of 3.6% per year. This is roughly consistent with the Federal Reserve’s (Fed) 2% inflation target.
Speaking of the Fed, bond markets sold off immediately after today’s data release, apparently in the belief that “strong” January job growth precludes further Fed easing. Our analysis obviously suggests a good bit of nuance to that perceived strength. Should inflation start to behave more in line with the Fed’s target—and with recent wage data—the actual details of the employment situation are quite conducive to further easing.